Daniocell
lactb2 (mesenchyme)
"lactamase, beta 2"
ZFIN
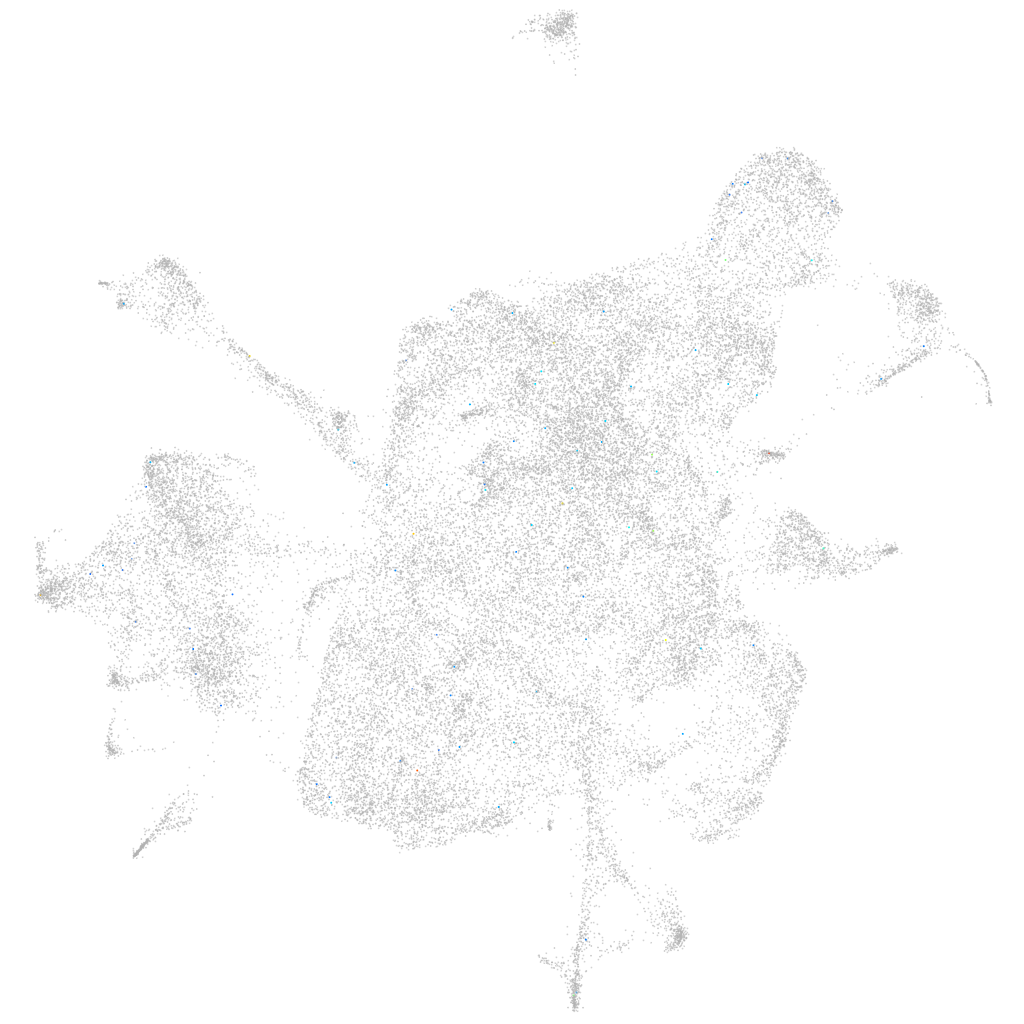
Gene expression UMAP
Display:
Expression
Stage
Other cell groups
all cells
blastomeres
PGCs
endoderm
axial mesoderm
muscle
mural cells /
non-skeletal muscle
mesenchyme
hematopoietic /
vasculature
pronephros
neural
spinal cord / glia
eye
taste / olfactory
otic / lateral line
epidermis
periderm
fin
ionocytes / mucous
pigment cells
Expression by stage/cluster
Correlated gene expression
Positive correlation
Negative correlation
Gene
r
Gene
r
LOC110438127
0.149
tuba8l4
-0.013
CR388163.1
0.135
rpl23a
-0.013
XLOC-028659
0.121
naca
-0.013
LOC110439805
0.121
rps24
-0.011
LOC110439547
0.110
hsp90ab1
-0.011
LOC103910375
0.110
hmga2
-0.011
si:dkey-183c6.7
0.107
gadd45gip1
-0.010
si:ch211-282j17.10
0.099
znf143a
-0.010
or106-8
0.089
sf3b2
-0.010
si:dkey-226n24.1
0.083
tmem131
-0.009
myoz3a
0.078
rap2b
-0.009
XLOC-011020
0.078
gpkow
-0.009
btr33
0.073
tubb2b
-0.009
si:dkey-3h2.2
0.073
mphosph10
-0.009
RF00319
0.072
lbr
-0.009
cfap206
0.072
kpnb1
-0.009
XLOC-024456
0.071
zgc:162025
-0.009
LOC103911458
0.068
irf2bp2a
-0.009
LO018598.1
0.065
med4
-0.009
LOC110439435
0.062
dmap1
-0.009
LOC110439690
0.060
cotl1
-0.009
LOC108183658
0.060
hsbp1a
-0.009
LOC108192008
0.060
ndc1
-0.009
XLOC-042037
0.058
tbl1xr1a
-0.009
crygs2
0.056
brd4
-0.009
znf1042
0.056
larp1
-0.009
st6gal1
0.055
rack1
-0.009
XLOC-012652
0.054
gnl3
-0.009
XLOC-043579
0.052
irs1
-0.009
mapk13
0.050
txndc9
-0.009
LOC108183387
0.049
ppp1r13l
-0.009
blk
0.049
ino80c
-0.009
tmem41ab
0.048
dolpp1
-0.009
si:dkey-29d5.2
0.048
rps2
-0.009
wdpcp
0.046
rbm6
-0.009