Daniocell
lactb2 (epidermis)
"lactamase, beta 2"
ZFIN
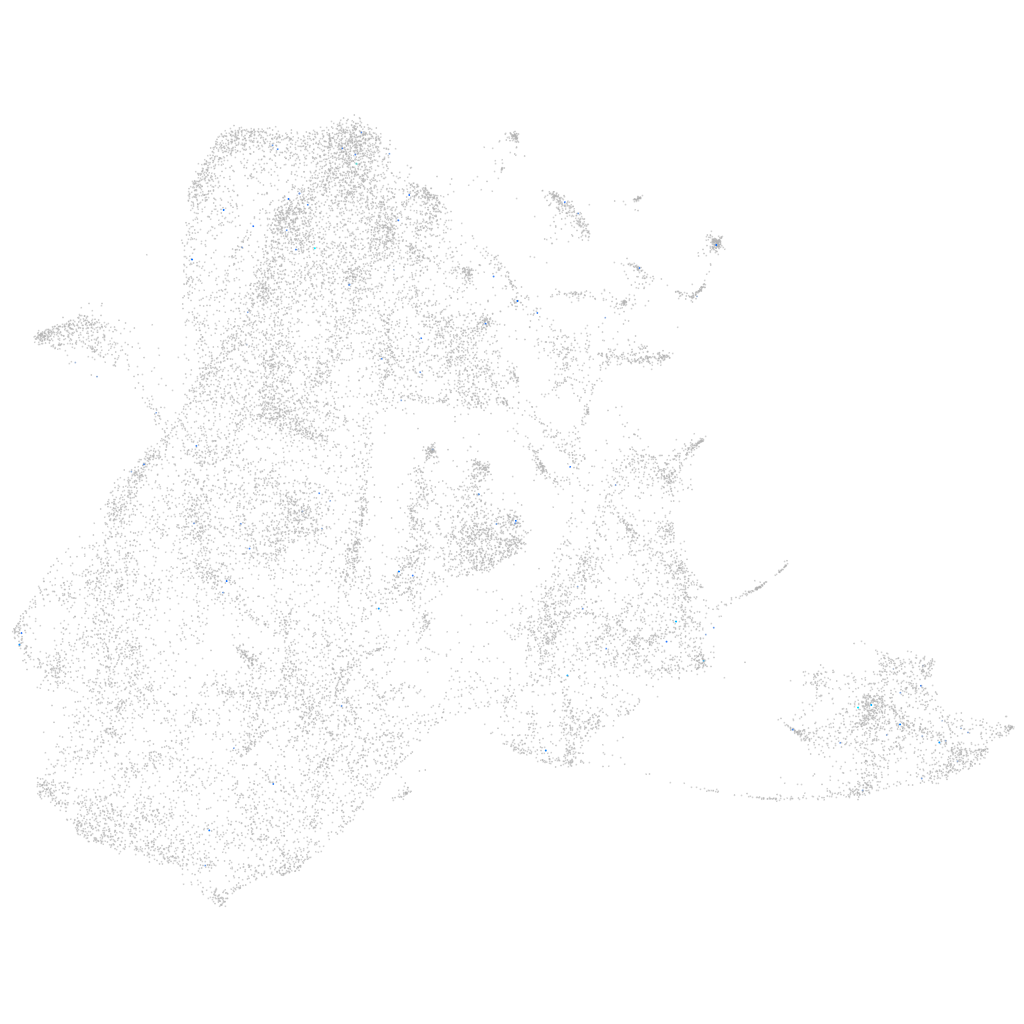
Gene expression UMAP
Display:
Expression
Stage
Other cell groups
all cells
blastomeres
PGCs
endoderm
axial mesoderm
muscle
mural cells /
non-skeletal muscle
mesenchyme
hematopoietic /
vasculature
pronephros
neural
spinal cord / glia
eye
taste / olfactory
otic / lateral line
epidermis
periderm
fin
ionocytes / mucous
pigment cells
Expression by stage/cluster
Correlated gene expression
Positive correlation
Negative correlation
Gene
r
Gene
r
LOC103910400
0.269
si:ch211-222l21.1
-0.018
oxgr1a.3
0.155
mmp30
-0.016
LOC100150033
0.121
marcksl1b
-0.016
CABZ01099833.1
0.089
hspb1
-0.016
si:dkey-7k24.5
0.084
dag1
-0.015
CT573178.1
0.082
BX927258.1
-0.015
LOC110437829
0.068
f3b
-0.015
XLOC-033352
0.068
lamb1a
-0.015
si:ch211-147g22.7
0.067
itga3b
-0.015
klhdc2
0.065
fstl1b
-0.015
taar14a
0.064
ppt1
-0.014
CABZ01079818.1
0.058
ctps1a
-0.014
crygm2f
0.057
nr2f5
-0.014
ccdc83
0.057
kctd15a
-0.014
tmem173
0.056
rrbp1b
-0.014
si:dkey-47k20.4
0.054
arrdc3b
-0.014
FQ312013.1
0.053
lama5
-0.014
XLOC-036686
0.053
ugdh
-0.014
CABZ01057891.1
0.053
tmsb4x
-0.014
si:dkey-47k16.4
0.053
XLOC-032526
-0.014
CABZ01025311.1
0.053
fkbp11
-0.014
si:dkey-42l16.1
0.051
flna
-0.014
LOC100537874
0.051
dlx3b
-0.014
BX255915.2
0.051
rbms2b
-0.014
LOC108183436
0.051
hoxb1b
-0.014
bcl6b
0.050
odc1
-0.013
ccdc166
0.049
p3h1
-0.013
nts
0.049
XLOC-001603
-0.013
CU459147.1
0.049
myl9b
-0.013
LOC103910935
0.048
fkbp9
-0.013
LOC103911046
0.047
calua
-0.013
LOC108191969
0.046
coq5
-0.013
zgc:66440
0.046
col5a3a
-0.013
lta
0.046
id1
-0.013
xaf1
0.045
slit2
-0.013