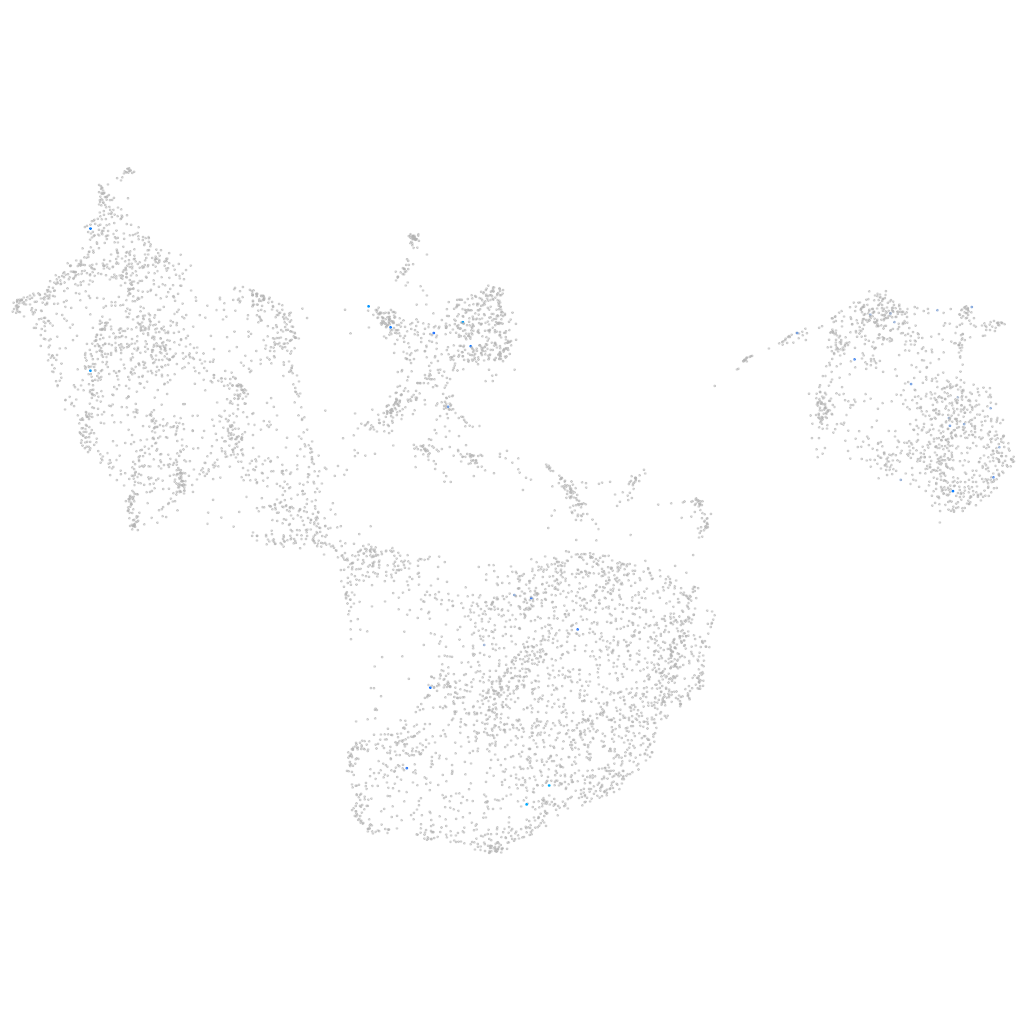
Daniocell
lactb2 (fin)
"lactamase, beta 2"
ZFIN
Gene expression UMAP
Display:
Expression
Stage
Other cell groups
all cells
blastomeres
PGCs
endoderm
axial mesoderm
muscle
mural cells /
non-skeletal muscle
mesenchyme
hematopoietic /
vasculature
pronephros
neural
spinal cord / glia
eye
taste / olfactory
otic / lateral line
epidermis
periderm
fin
ionocytes / mucous
pigment cells
Expression by stage/cluster
Correlated gene expression
Positive correlation
Negative correlation
Gene
r
Gene
r
nanos2
0.337
rpl37
-0.035
FP103009.1
0.304
si:dkey-151g10.6
-0.035
zp2l2
0.297
rpl38
-0.034
si:ch1073-526c11.3
0.291
rps29
-0.034
LOC108179099
0.291
rpl39
-0.034
LO018011.1
0.211
rpl29
-0.032
si:dkey-197j19.5
0.190
rplp2l
-0.032
si:ch211-81a5.5
0.173
rplp1
-0.030
LOC110439812
0.165
rpl36a
-0.029
XLOC-018110
0.149
rpl32
-0.029
CABZ01088484.1
0.148
rps12
-0.027
si:dkey-172o19.2
0.143
rps28
-0.027
LOC100537389
0.139
rpl27a
-0.026
LOC108183855
0.134
rps24
-0.025
rasgrp2
0.133
stmn1a
-0.022
si:dkey-152b24.6
0.132
cstf1
-0.022
cand2
0.130
zc3h15
-0.021
LO018363.2
0.128
mt-nd3
-0.021
LOC110438469
0.127
rps21
-0.020
LOC103911555
0.125
setb
-0.020
LOC110439956
0.124
mki67
-0.020
kcne4
0.124
rps19
-0.020
si:ch211-215e19.4
0.118
rpl31
-0.020
homer3a
0.111
prpf39
-0.020
si:ch211-271e10.2
0.110
cks1b
-0.019
si:ch73-22o18.1
0.109
mycn
-0.019
abcc8b
0.109
mcm7
-0.019
kifl
0.106
akap8l
-0.019
CR626886.2
0.106
brd7
-0.019
tmem125
0.106
pgam5
-0.018
si:ch211-240l19.8
0.103
si:dkeyp-113d7.1
-0.018
LOC101885459
0.102
hnrnph1l
-0.018
XLOC-025051
0.102
rpl36
-0.018
pcdh1g9
0.100
tgm2b
-0.018
myh11b
0.098
parp1
-0.018