Daniocell
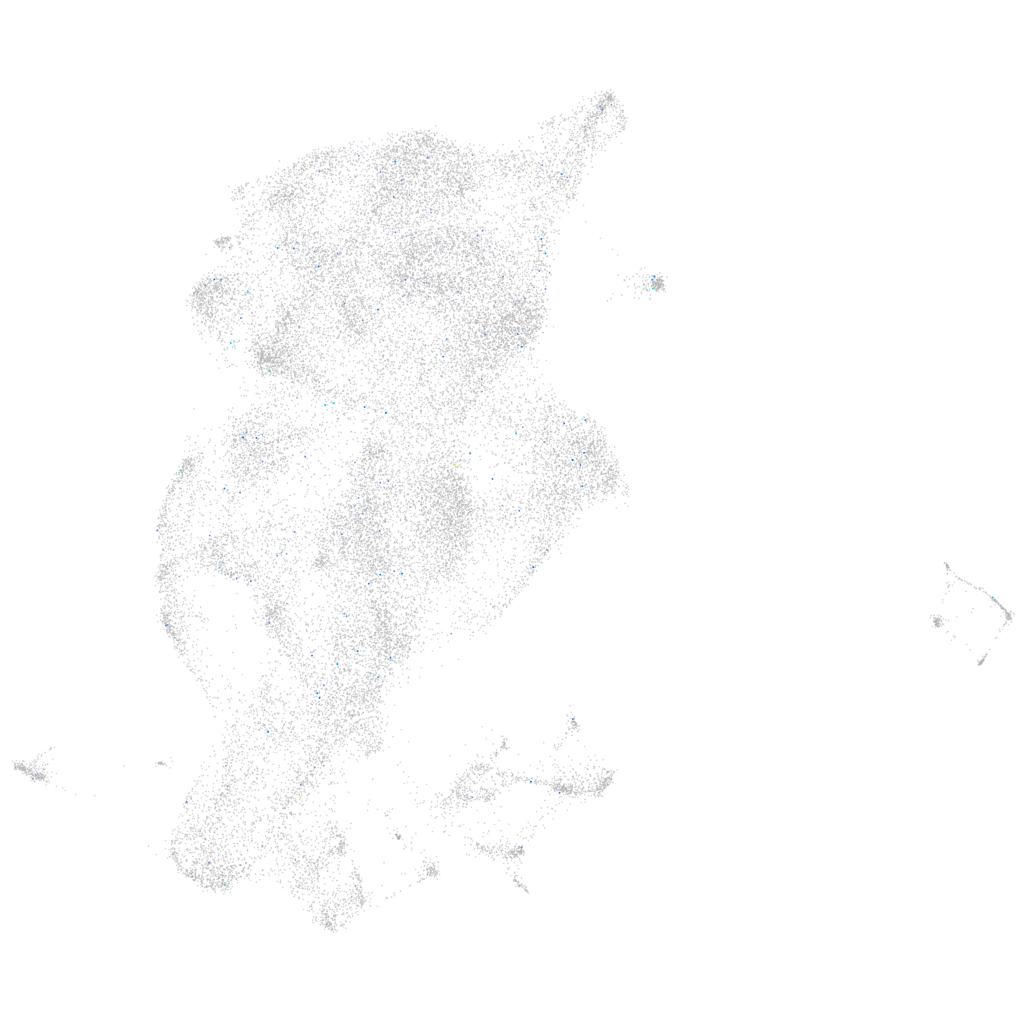
lactb2 (periderm)
"lactamase, beta 2"
ZFIN
Gene expression UMAP
Display:
Expression
Stage
Other cell groups
all cells
blastomeres
PGCs
endoderm
axial mesoderm
muscle
mural cells /
non-skeletal muscle
mesenchyme
hematopoietic /
vasculature
pronephros
neural
spinal cord / glia
eye
taste / olfactory
otic / lateral line
epidermis
periderm
fin
ionocytes / mucous
pigment cells
Expression by stage/cluster
Correlated gene expression
Positive correlation
Negative correlation
Gene
r
Gene
r
si:ch211-227e10.2
0.146
actc1b
-0.023
CT027805.1
0.137
pvalb2
-0.020
znf1055
0.122
pvalb1
-0.020
si:ch211-137j23.8
0.117
mcm2
-0.014
slco1e1
0.112
zgc:158463
-0.013
ftr35
0.092
acaca
-0.013
tnfrsf18
0.087
klf11a
-0.013
XLOC-031900
0.086
mylpfa
-0.012
chrdl2
0.083
znf207a
-0.012
LOC103910844
0.080
rtn3
-0.012
si:ch211-127b6.2
0.080
CT027638.1
-0.012
LOC103910439
0.077
RPL37A
-0.012
LOC108183686
0.071
LOC110439372
-0.011
CR555293.1
0.070
CABZ01068251.1
-0.011
si:dkey-78l4.2
0.062
utp4
-0.011
fgf14
0.061
hbbe2
-0.010
si:dkey-83f18.5
0.061
setdb1a
-0.010
CR759810.1
0.060
cdc6
-0.010
XLOC-004729
0.060
sppl3
-0.010
rhobtb2a
0.059
lrch3
-0.010
LOC103911047
0.059
vps13d
-0.010
LOC101883802
0.057
mrps23
-0.010
LOC108181107
0.056
CABZ01072614.1
-0.010
or128-1
0.055
lyrm2
-0.010
pih1d3
0.055
tpma
-0.010
si:ch211-229c8.13
0.053
pgap1
-0.010
FO904898.5
0.053
acta1b
-0.010
sat2a
0.053
tnnt3b
-0.010
armc4
0.053
gnsb
-0.010
slc25a27
0.052
oplah
-0.010
LOC110438179
0.051
bahd1
-0.010
BX537168.1
0.050
kmt2e
-0.010
theg
0.049
hbae1.3
-0.010
si:ch211-254p10.2
0.049
tatdn1
-0.010
zbtb8b
0.048
rbmx2
-0.009