Daniocell
lactb2 (hematopoietic / vasculature)
"lactamase, beta 2"
ZFIN
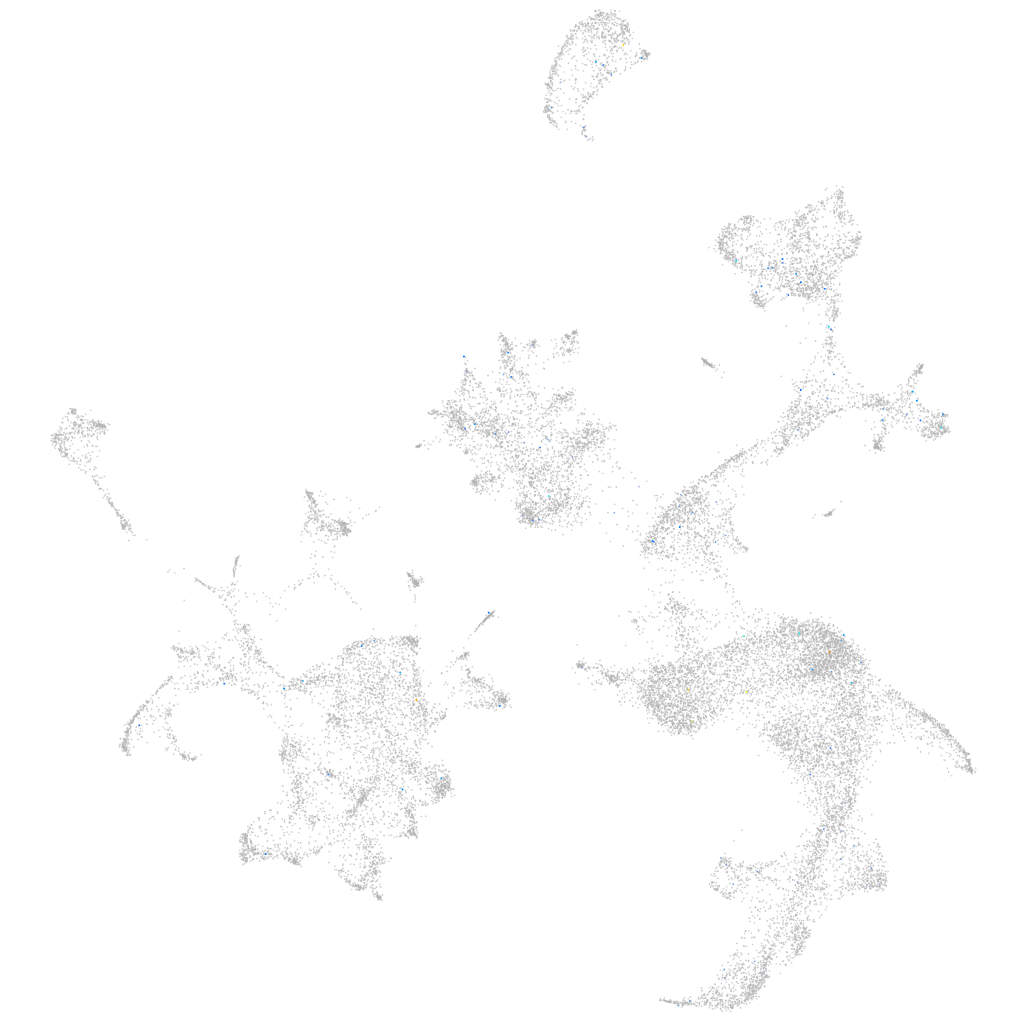
Gene expression UMAP
Display:
Expression
Stage
Other cell groups
all cells
blastomeres
PGCs
endoderm
axial mesoderm
muscle
mural cells /
non-skeletal muscle
mesenchyme
hematopoietic /
vasculature
pronephros
neural
spinal cord / glia
eye
taste / olfactory
otic / lateral line
epidermis
periderm
fin
ionocytes / mucous
pigment cells
Expression by stage/cluster
Correlated gene expression
Positive correlation
Negative correlation
Gene
r
Gene
r
CU929145.3
0.290
aqp1a.1
-0.016
si:dkey-7i4.15
0.213
tbcelb
-0.014
si:ch211-1f22.2
0.181
akap12b
-0.014
palmdb
0.177
cyt1l
-0.014
oscp1b
0.152
krtt1c19e
-0.014
si:dkey-145c18.3
0.138
tspan4b
-0.013
trpm5
0.110
hbbe3
-0.013
LOC101882509
0.107
CABZ01072614.1
-0.012
snx1b
0.105
LOC101884451
-0.012
notum2
0.099
zgc:112332
-0.012
LOC110437883
0.095
hspb1
-0.012
LOC108183434
0.094
mterf3
-0.012
CT583723.2
0.091
reep3b
-0.012
kcnh5a
0.088
calub
-0.011
tex36
0.079
ppp2cab
-0.011
CU655870.1
0.078
cav1
-0.011
LOC101884727
0.078
acads
-0.011
terb2
0.078
kdr
-0.011
si:dkey-202e17.1
0.078
sparc
-0.011
CU466278.2
0.075
hbae1.3
-0.011
LO018168.1
0.073
apoa1b
-0.011
LOC110438610
0.071
podxl
-0.011
RF00263
0.071
fkbp7
-0.011
si:dkey-70b23.2
0.070
AL935174.5
-0.011
slc10a2
0.068
st3gal4
-0.011
CABZ01007816.1
0.068
ddah2
-0.010
BX663516.2
0.067
slc22a31
-0.010
cryba1a
0.066
hbbe1.3
-0.010
si:ch211-225p5.8
0.064
myl6
-0.010
si:dkey-117a8.4
0.063
mgll
-0.010
irs4a
0.063
si:dkey-16p21.8
-0.010
cysltr2a
0.061
pfkma
-0.010
FOXN2 (1 of many)
0.061
h1f0
-0.010
LOC101886196
0.060
kcnn4
-0.010
CU695222.2
0.059
cox4i2
-0.010