Daniocell
lactb2 (taste / olfactory)
"lactamase, beta 2"
ZFIN
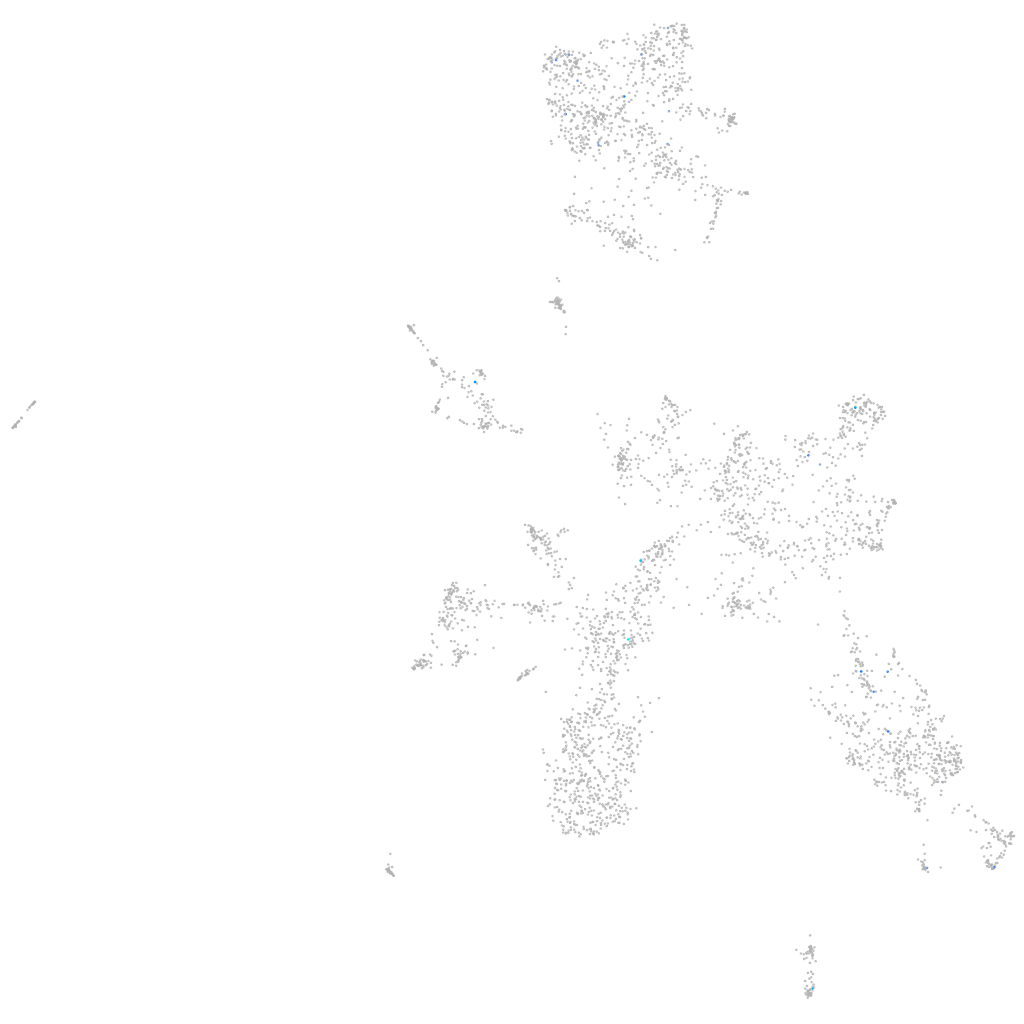
Gene expression UMAP
Display:
Expression
Stage
Other cell groups
all cells
blastomeres
PGCs
endoderm
axial mesoderm
muscle
mural cells /
non-skeletal muscle
mesenchyme
hematopoietic /
vasculature
pronephros
neural
spinal cord / glia
eye
taste / olfactory
otic / lateral line
epidermis
periderm
fin
ionocytes / mucous
pigment cells
Expression by stage/cluster
Correlated gene expression
Positive correlation
Negative correlation
Gene
r
Gene
r
LOC108183749
0.455
mt-co2
-0.037
LOC110437979
0.380
cox8a
-0.032
pth4
0.380
taf9
-0.031
AL954666.1
0.331
pole4
-0.030
LOC101885769
0.331
atp5mea
-0.030
LOC110440219
0.331
h1f0
-0.029
XLOC-009562
0.247
fth1a
-0.028
LOC103908936
0.214
mt-co1
-0.028
rbfox1l
0.182
camk2g1
-0.028
kcnj1a.6
0.179
atf6
-0.028
si:dkeyp-82a1.4
0.177
cbx3a
-0.028
ogfrl1
0.174
fstl5
-0.028
LOC101884641
0.163
spock1
-0.027
rnaset2l
0.159
NC-002333.4
-0.027
BX899181.1
0.154
nkrf
-0.027
si:ch211-232m10.6
0.154
ctsba
-0.026
XLOC-039167
0.152
brd7
-0.026
pcdh12
0.148
b3gat1b
-0.026
LOC103909784
0.147
ptk7a
-0.025
anxa6
0.146
nme3
-0.025
p2ry8
0.144
ppp6r3
-0.025
si:ch73-138e16.3
0.143
si:rp71-17i16.6
-0.025
LOC101887033
0.141
cbx4
-0.025
irgq2
0.140
prkcbp1l
-0.025
XLOC-034167
0.139
wasf3b
-0.024
LOC108182766
0.137
slx1b
-0.024
LOC103911530
0.136
pvalb5
-0.024
gtf3ab
0.133
zgc:153675
-0.024
si:dkey-228a15.1
0.129
camlg
-0.023
slc2a11b
0.127
gtf2h3
-0.023
XLOC-042774
0.127
itm2ba
-0.023
pimr214
0.124
lamp1b
-0.023
klf10
0.122
tusc2b
-0.023
zgc:171490
0.120
add2
-0.023
kcnj5
0.120
gigyf1a
-0.023