Daniocell
lactb2 (glial cells / spinal cord)
"lactamase, beta 2"
ZFIN
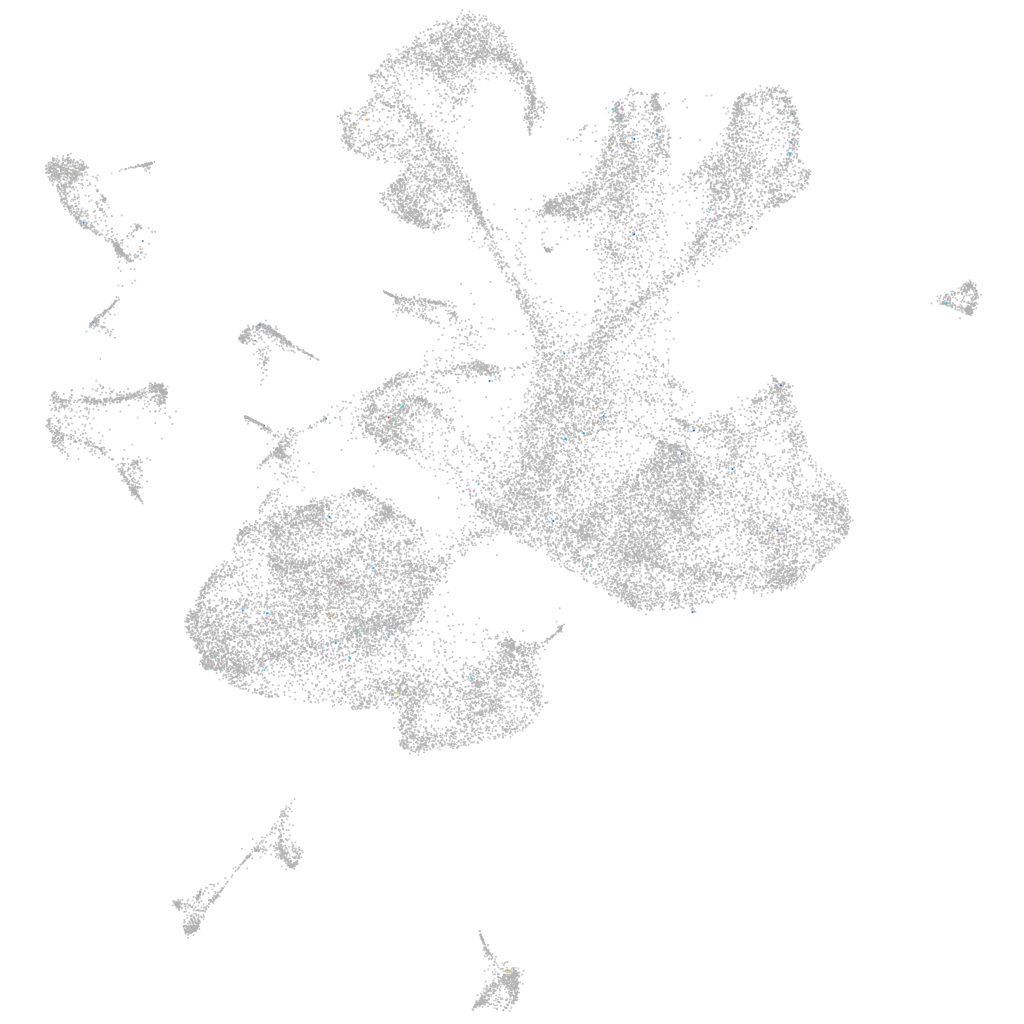
Gene expression UMAP
Display:
Expression
Stage
Other cell groups
all cells
blastomeres
PGCs
endoderm
axial mesoderm
muscle
mural cells /
non-skeletal muscle
mesenchyme
hematopoietic /
vasculature
pronephros
neural
spinal cord / glia
eye
taste / olfactory
otic / lateral line
epidermis
periderm
fin
ionocytes / mucous
pigment cells
Expression by stage/cluster
Correlated gene expression
Positive correlation
Negative correlation
Gene
r
Gene
r
BX088524.2
0.145
rps4x
-0.023
BX465186.1
0.120
si:ch211-222l21.1
-0.019
LOC100149554.1
0.111
hmga1a
-0.019
LOC100334495
0.106
eef2b
-0.016
adipoqb
0.089
sinhcafl
-0.016
LOC101884295
0.084
uba52
-0.016
zgc:194252
0.080
rpl15
-0.015
LOC110439439
0.077
fth1a
-0.015
BX005129.5
0.075
rpl32
-0.015
LOC101885979
0.075
rack1
-0.015
BX908799.1
0.071
rcor2
-0.015
pimr132
0.070
mex3b
-0.015
AL928920.4
0.070
snrpf
-0.015
LOC101886293
0.066
si:ch73-1a9.3
-0.014
LOC110440113
0.065
si:ch73-46j18.5
-0.014
LOC108190763
0.060
rpl37
-0.014
CABZ01048453.1
0.059
nutf2
-0.014
gbp1
0.059
ddx61
-0.014
dnd1
0.058
nono
-0.014
CT573337.1
0.058
si:ch211-137a8.4
-0.014
myhc4
0.055
sox11a
-0.014
smyd1a
0.054
ptmab
-0.014
LOC101885813
0.054
rps27.1
-0.014
eya2
0.053
NC-002333.4
-0.014
XLOC-023761
0.052
btf3
-0.013
atp8b2
0.052
setb
-0.013
CR848025.2
0.051
tpt1
-0.013
XLOC-006827
0.051
gdi2
-0.013
tmem130
0.051
rpl5a
-0.013
myha
0.049
hmgb3a
-0.013
CR361551.1
0.048
si:ch211-288g17.3
-0.013
CR847898.1
0.048
eef1g
-0.012
si:ch211-272h9.5
0.048
cirbpb
-0.012
ccbe1
0.048
ddx21
-0.012
zgc:194189
0.046
sephs1
-0.012