
eukaryotic translation initiation factor 4Bb
ZFIN 
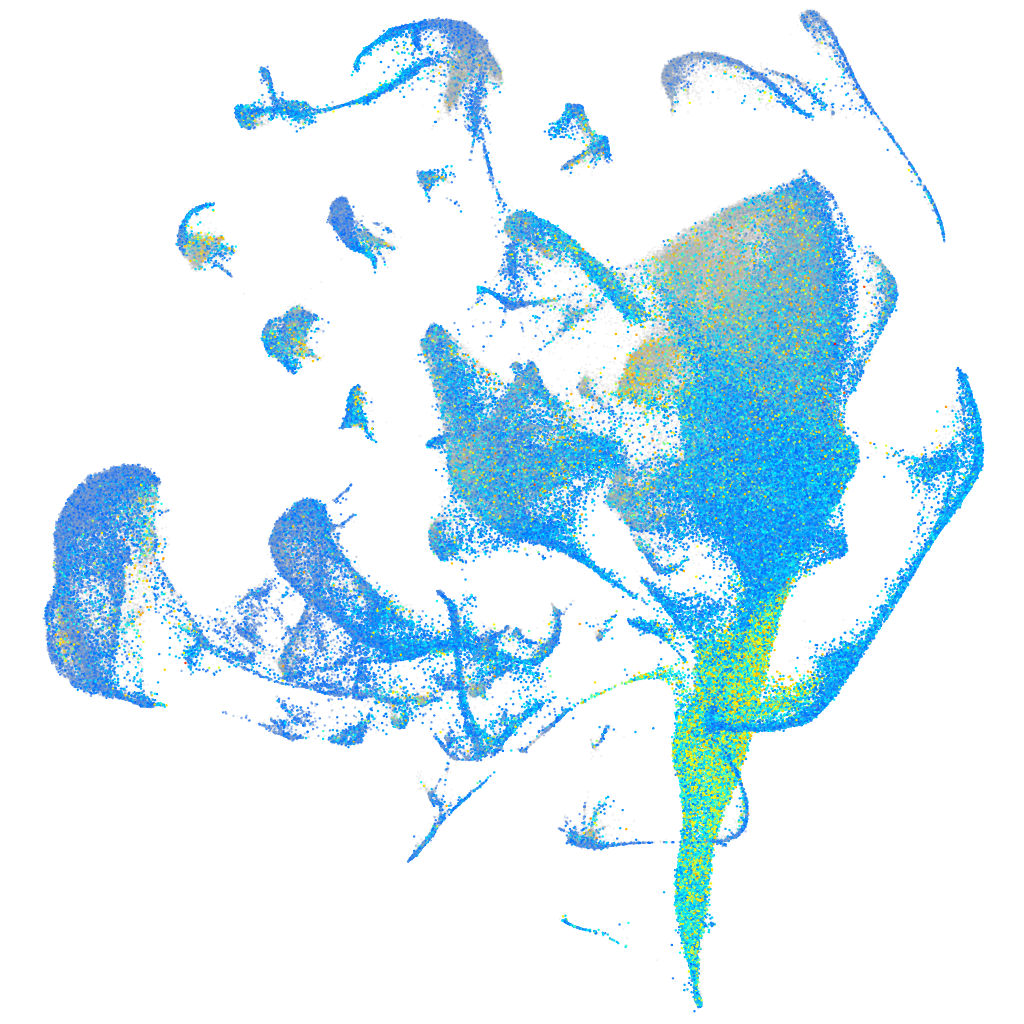
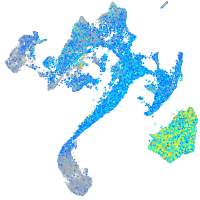
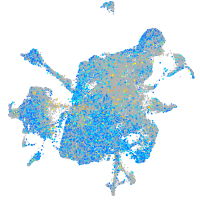
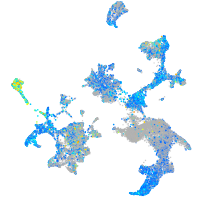
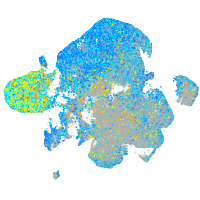
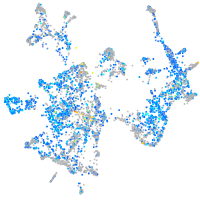
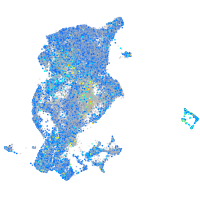
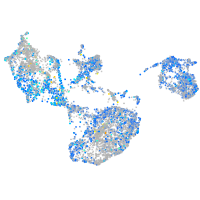
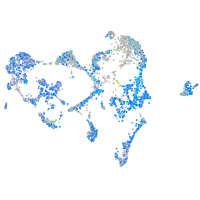
Gene expression UMAP


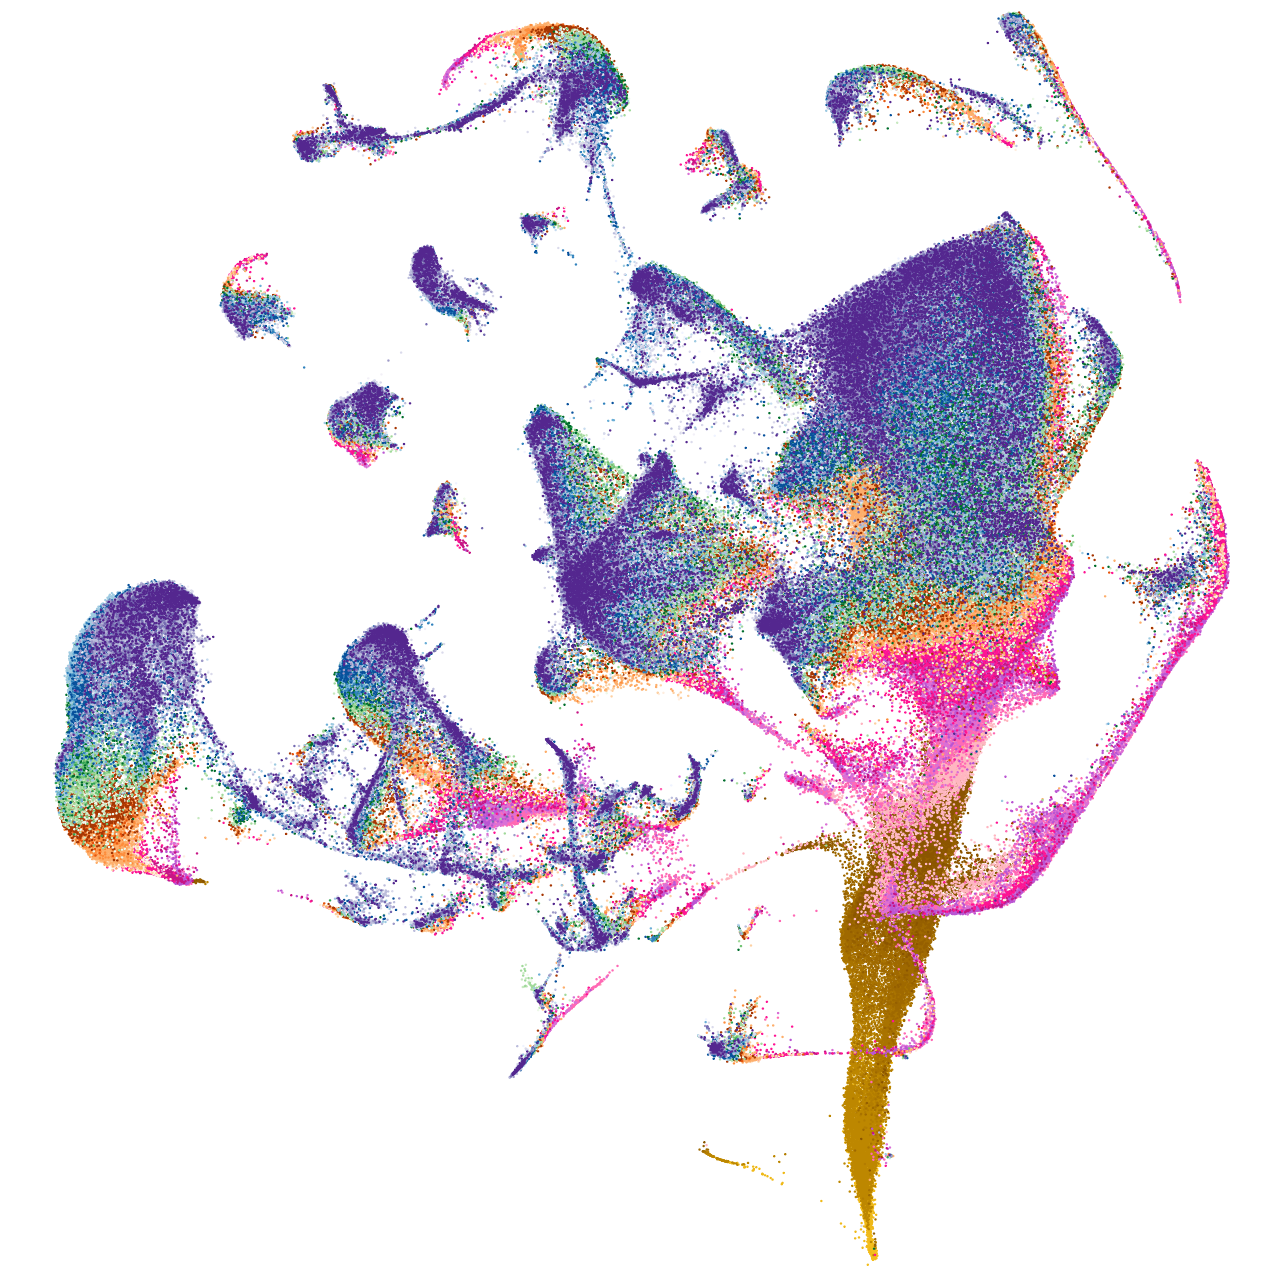


Expression by stage/cluster
Correlated gene expression
| Positive correlation | Negative correlation | ||
| Gene | r | Gene | r |
| npm1a | 0.507 | pvalb1 | -0.227 |
| nop58 | 0.504 | pvalb2 | -0.221 |
| fbl | 0.497 | ccni | -0.203 |
| dkc1 | 0.494 | calm1a | -0.186 |
| ncl | 0.486 | actc1b | -0.184 |
| nop56 | 0.469 | krt4 | -0.176 |
| hspb1 | 0.465 | gpm6aa | -0.175 |
| snu13b | 0.453 | hbbe1.3 | -0.175 |
| nop2 | 0.440 | cyt1 | -0.174 |
| ebna1bp2 | 0.428 | stmn1b | -0.174 |
| hnrnpa1b | 0.427 | gapdhs | -0.173 |
| gar1 | 0.422 | rtn1a | -0.172 |
| gnl3 | 0.420 | dap1b | -0.170 |
| bms1 | 0.419 | hbae3 | -0.167 |
| nhp2 | 0.412 | rnasekb | -0.166 |
| lig1 | 0.406 | ckbb | -0.164 |
| snrpb | 0.405 | atp6v0cb | -0.162 |
| ddx18 | 0.404 | gng3 | -0.159 |
| rsl1d1 | 0.403 | gpm6ab | -0.159 |
| ppig | 0.401 | atp6v1e1b | -0.156 |
| rrp1 | 0.397 | gabarapl2 | -0.155 |
| si:ch211-152c2.3 | 0.394 | wu:fb55g09 | -0.154 |
| anp32b | 0.391 | marcksl1a | -0.153 |
| seta | 0.390 | tob1b | -0.152 |
| zmp:0000000624 | 0.388 | cyt1l | -0.151 |
| banf1 | 0.387 | icn | -0.151 |
| mphosph10 | 0.386 | ier2b | -0.151 |
| pes | 0.386 | hbae1.1 | -0.150 |
| eif5a2 | 0.385 | sncb | -0.149 |
| lyar | 0.385 | krtt1c19e | -0.148 |
| nop10 | 0.384 | anxa1a | -0.145 |
| pprc1 | 0.384 | elavl3 | -0.144 |
| pdap1a | 0.383 | hbbe1.1 | -0.144 |
| wdr43 | 0.378 | atp6v1g1 | -0.143 |
| nolc1 | 0.377 | mylpfa | -0.143 |