Daniocell
zgc:165514 (pronephros)
zgc:165514
ZFIN
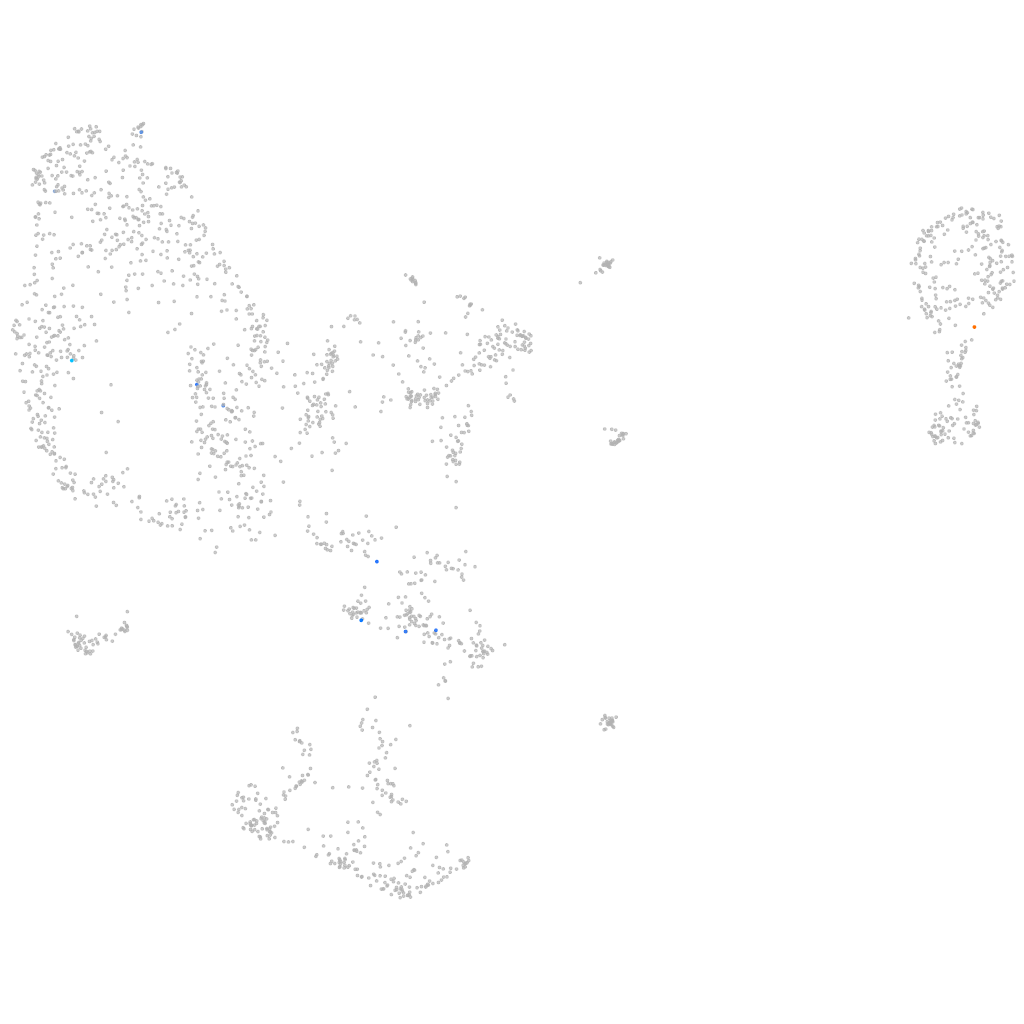
Gene expression UMAP
Display:
Expression
Stage
Other cell groups
all cells
blastomeres
PGCs
endoderm
axial mesoderm
muscle
mural cells /
non-skeletal muscle
mesenchyme
hematopoietic /
vasculature
pronephros
neural
spinal cord / glia
eye
taste / olfactory
otic / lateral line
epidermis
periderm
fin
ionocytes / mucous
pigment cells
Expression by stage/cluster
Correlated gene expression
Positive correlation
Negative correlation
Gene
r
Gene
r
irf1a
0.744
rpl31
-0.098
vwa10.2
0.724
rpl14
-0.082
XLOC-017191
0.680
rpl38
-0.076
si:dkeyp-92c9.2
0.618
actb2
-0.076
si:ch73-368j24.12
0.440
cirbpb
-0.050
CABZ01109604.1
0.414
rps13
-0.046
XLOC-014490
0.405
zgc:153867
-0.045
BX323839.1
0.347
eef2b
-0.045
si:ch73-36p18.1
0.341
atp5f1e
-0.045
gpx2
0.335
eif5
-0.044
sh2d4bb
0.326
nme2b.1
-0.044
emilin3a
0.319
atp5f1b
-0.043
fancm
0.318
glrx
-0.042
hoxa11a
0.317
actb1
-0.042
si:dkey-235d18.5
0.312
mt-co1
-0.042
wu:fb59d01
0.306
atp5pd
-0.039
sfrp2l
0.302
cox4i1
-0.039
si:dkeyp-86c4.1
0.287
atp1b1a
-0.038
LOC108183929
0.285
atp5pf
-0.038
atad5b
0.270
ppiaa
-0.038
si:dkey-90l8.3
0.263
cox5aa
-0.037
rad9a
0.257
uqcrq
-0.037
brca2
0.252
cd81a
-0.037
ephb4b
0.247
pnrc2
-0.037
si:dkey-253d23.9
0.235
sdhc
-0.036
ercc6l2
0.233
arpc2
-0.036
pcsk5a
0.231
atp5pb
-0.036
CABZ01071020.1
0.230
khdrbs1b
-0.036
LOC110438512
0.227
echs1
-0.035
tspan2a
0.225
nfkbiab
-0.035
atp1b2b
0.224
atp5mf
-0.034
elovl4b
0.220
calm2b
-0.034
fibinb
0.215
si:ch211-139a5.9
-0.034
sdccag8
0.214
zgc:193541
-0.034
mllt3
0.211
zgc:162944
-0.034