Daniocell
zgc:165514 (otic / lateral line)
zgc:165514
ZFIN
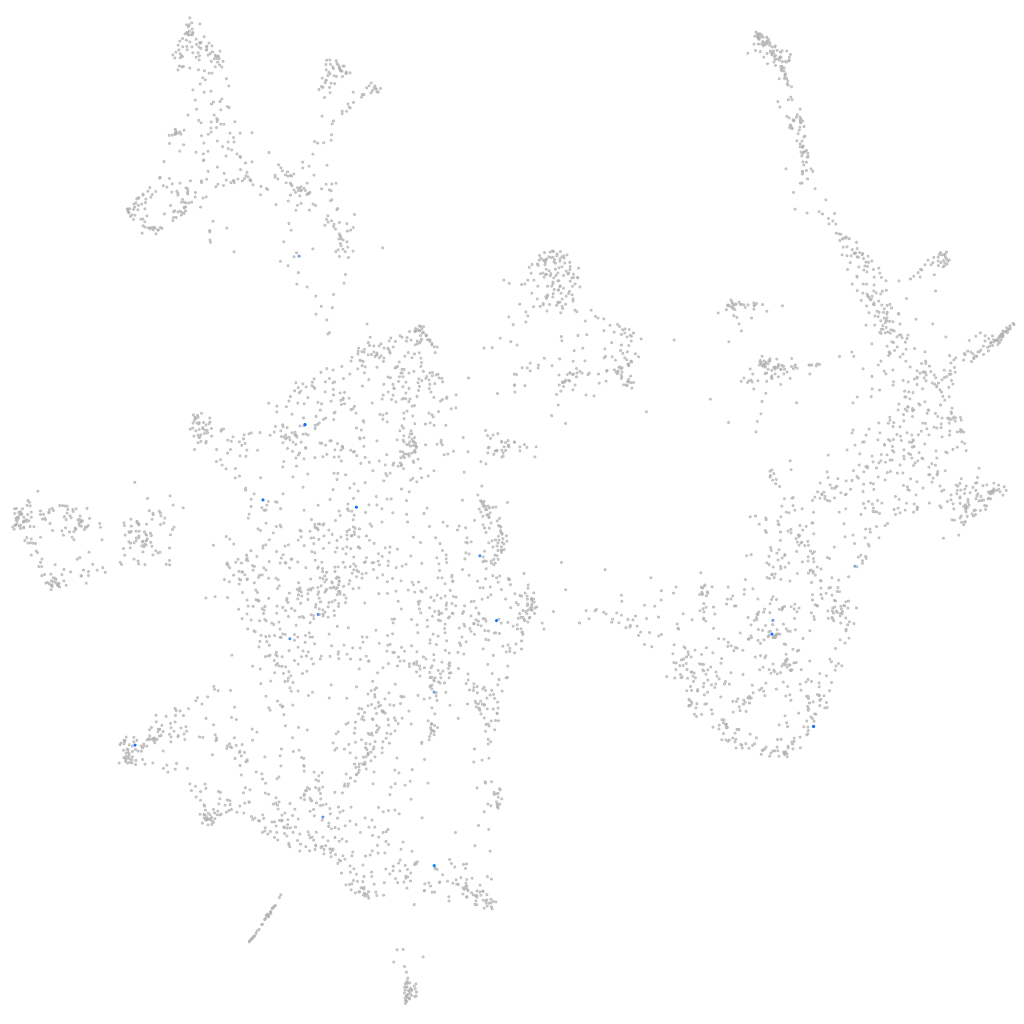
Gene expression UMAP
Display:
Expression
Stage
Other cell groups
all cells
blastomeres
PGCs
endoderm
axial mesoderm
muscle
mural cells /
non-skeletal muscle
mesenchyme
hematopoietic /
vasculature
pronephros
neural
spinal cord / glia
eye
taste / olfactory
otic / lateral line
epidermis
periderm
fin
ionocytes / mucous
pigment cells
Expression by stage/cluster
Correlated gene expression
Positive correlation
Negative correlation
Gene
r
Gene
r
BX511253.1
0.378
phb2a
-0.031
LOC101884967
0.301
mrps18c
-0.030
nitr3a
0.301
agpat3
-0.029
ccdc162
0.285
impdh1b
-0.028
AL954666.1
0.280
park7
-0.028
CABZ01117607.1
0.280
si:ch211-153b23.5
-0.028
bmp10
0.280
cd99
-0.028
CR749168.2
0.280
ptges3a
-0.027
cyp2p8
0.274
pim1
-0.026
si:ch211-246e12.3
0.270
h1f0
-0.026
FO203432.1
0.266
polr3f
-0.026
si:ch73-15n24.1
0.254
rgma
-0.026
XLOC-042763
0.240
calm1b
-0.026
BX927078.1
0.216
cdk2ap2
-0.025
FP101875.2
0.209
b2ml
-0.025
LOC100535208
0.202
cox17
-0.025
CT583650.1
0.193
yy1b
-0.025
CU468917.1
0.187
mrpl40
-0.025
XLOC-014485
0.181
mrpl23
-0.025
zgc:153311
0.180
atp6v0cb
-0.025
togaram1
0.170
ssu72
-0.025
XLOC-029657
0.170
pvalb8
-0.024
aqp3b
0.167
gpx1b
-0.024
LOC103910768
0.167
pkig
-0.024
BX248113.1
0.164
rprd1b
-0.024
LOC110438365
0.160
si:dkey-205h13.2
-0.024
LOC110437705
0.160
peli1b
-0.023
LOC108181518
0.159
creg1
-0.023
AL935300.2
0.159
arl5c
-0.023
LOC100536860
0.159
sat1a.2
-0.023
tmem179b
0.152
rbmx2
-0.023
si:dkey-23i12.9
0.148
gadd45ga
-0.023
asz1
0.148
aldocb
-0.023
LOC101885646
0.146
cebpb
-0.023
msh3
0.139
osbpl1a
-0.023