Daniocell
zgc:165514 (endoderm)
zgc:165514
ZFIN
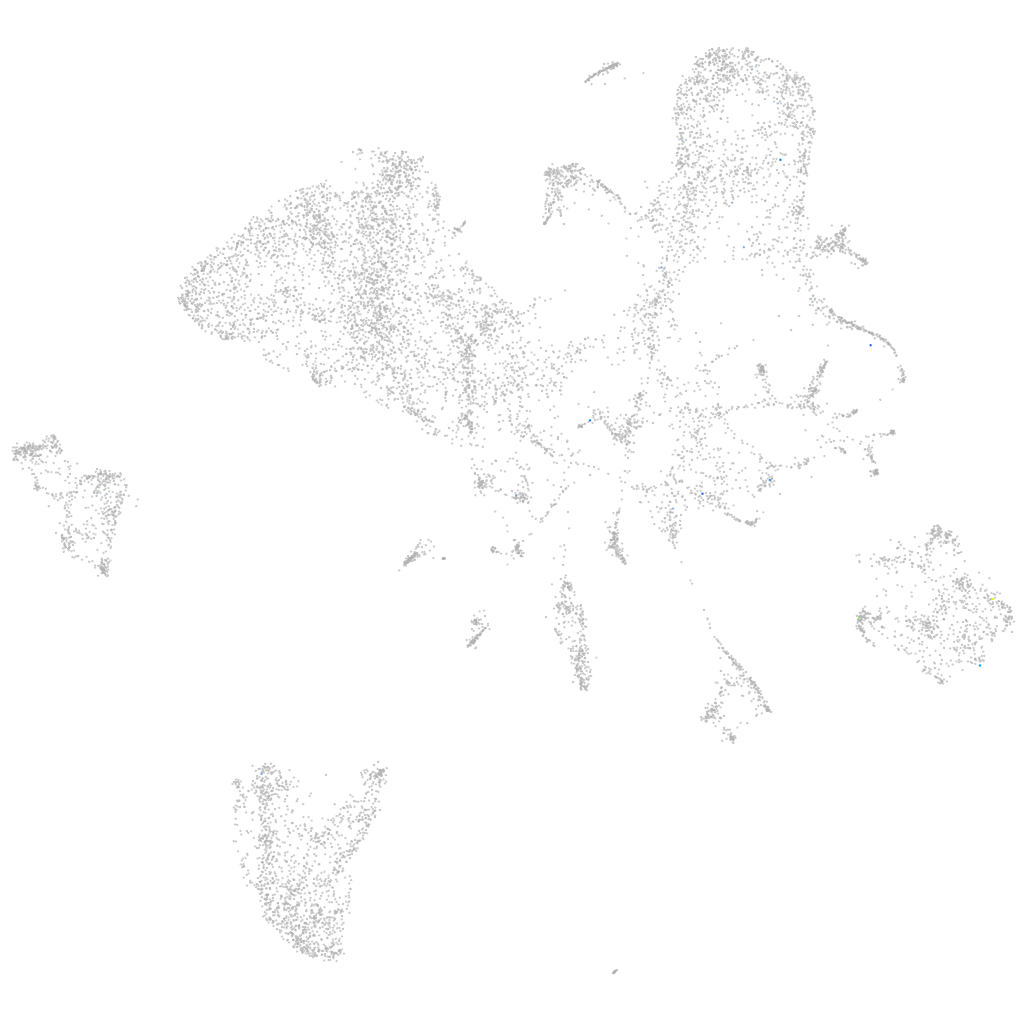
Gene expression UMAP
Display:
Expression
Stage
Other cell groups
all cells
blastomeres
PGCs
endoderm
axial mesoderm
muscle
mural cells /
non-skeletal muscle
mesenchyme
hematopoietic /
vasculature
pronephros
neural
spinal cord / glia
eye
taste / olfactory
otic / lateral line
epidermis
periderm
fin
ionocytes / mucous
pigment cells
Expression by stage/cluster
Correlated gene expression
Positive correlation
Negative correlation
Gene
r
Gene
r
znf1045
0.520
rpl37
-0.030
CR354564.1
0.400
rps10
-0.029
XLOC-001437
0.324
gamt
-0.028
kiss1ra
0.291
apoa1b
-0.027
NC-002333.9
0.270
apoa2
-0.027
si:ch73-45o6.2
0.262
bhmt
-0.026
st6gal1
0.254
zgc:92744
-0.026
morc3b
0.233
fabp3
-0.026
si:ch211-9d9.1
0.222
ahcy
-0.026
XLOC-035318
0.221
nme2b.1
-0.025
XLOC-015286
0.210
zgc:114188
-0.025
si:ch211-232i5.1
0.209
eno3
-0.025
dgkb
0.207
abat
-0.025
chrng
0.204
aqp12
-0.024
si:dkey-284p5.3
0.193
nupr1b
-0.024
LOC103910596
0.190
COX7A2 (1 of many)
-0.024
casc1
0.189
grhprb
-0.024
XLOC-005677
0.185
gatm
-0.024
gata1b
0.181
mat1a
-0.024
mxb
0.180
tfa
-0.024
znf1093
0.179
gpd1b
-0.024
LOC103910566
0.169
kng1
-0.024
mon1ba
0.158
rbp4
-0.023
LOC101882921
0.149
agxtb
-0.023
AL929217.1
0.148
zgc:123103
-0.023
CU693484.1
0.145
atp5if1b
-0.023
si:ch211-125e6.12
0.143
serpina1
-0.023
prom1a
0.139
tpi1b
-0.023
XLOC-035147
0.135
mgst1.2
-0.023
LOC110439327
0.129
serpina1l
-0.023
tnfsf14
0.129
rbp2b
-0.023
si:dkey-20i20.11
0.126
apom
-0.023
si:dkey-152b24.8
0.126
pklr
-0.022
BX323793.1
0.126
fabp10a
-0.022
CR352226.3
0.123
pgm1
-0.022