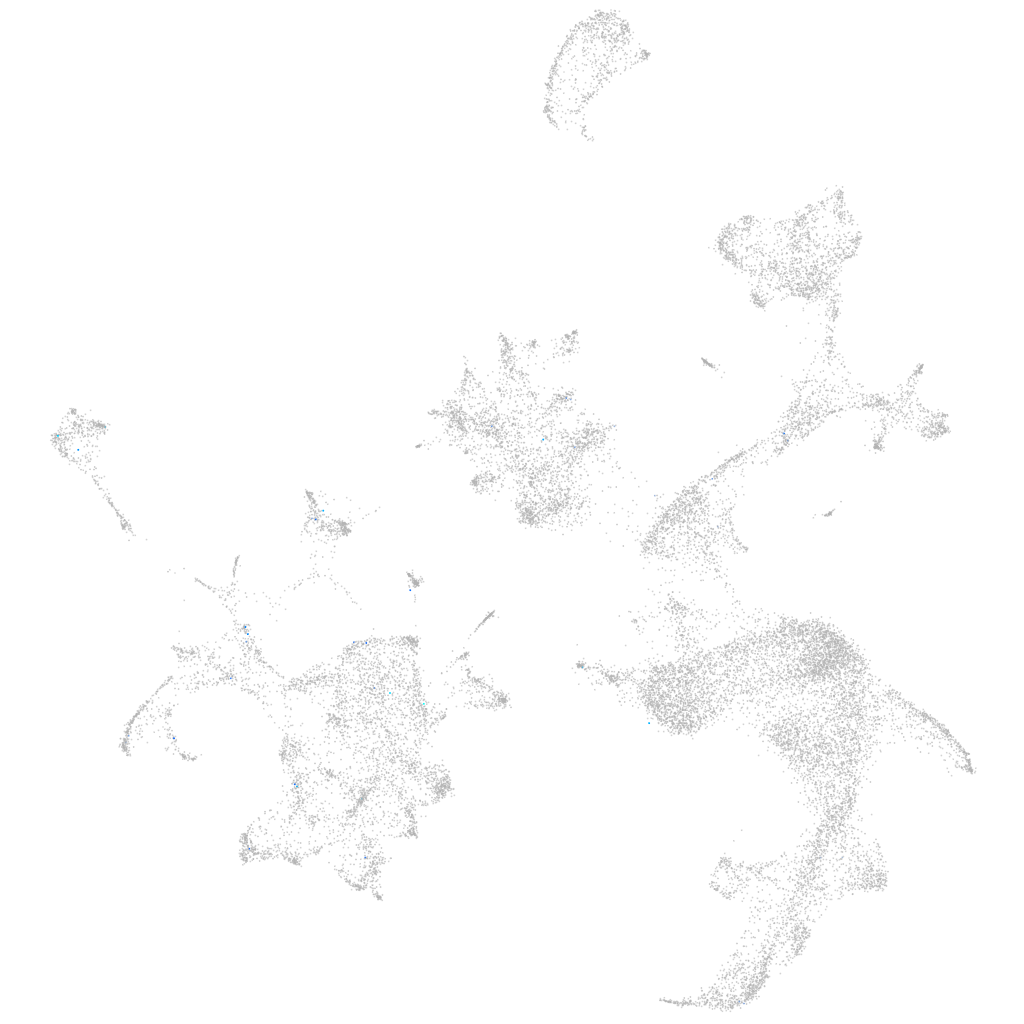
Daniocell
zgc:165514 (hematopoietic / vasculature)
zgc:165514
ZFIN
Gene expression UMAP
Display:
Expression
Stage
Other cell groups
all cells
blastomeres
PGCs
endoderm
axial mesoderm
muscle
mural cells /
non-skeletal muscle
mesenchyme
hematopoietic /
vasculature
pronephros
neural
spinal cord / glia
eye
taste / olfactory
otic / lateral line
epidermis
periderm
fin
ionocytes / mucous
pigment cells
Expression by stage/cluster
Correlated gene expression
Positive correlation
Negative correlation
Gene
r
Gene
r
AL627126.1
0.282
hbbe2
-0.024
RNF14
0.254
fth1a
-0.023
BX510941.1
0.221
creg1
-0.023
alg13
0.177
hbae1.3
-0.022
BX511013.1
0.163
hbbe1.3
-0.022
si:dkey-11e23.9
0.146
hbae1.1
-0.022
CR376741.4
0.141
blvrb
-0.022
CABZ01069945.1
0.141
cahz
-0.022
CU467646.2
0.135
hbbe1.1
-0.022
CT030153.1
0.129
hbae3
-0.020
LOC101884081
0.122
tspo
-0.020
BX470229.1
0.119
prdx2
-0.020
FO704607.1
0.113
hemgn
-0.020
slc35f3a
0.112
si:ch211-250g4.3
-0.019
LO018605.3
0.111
hbbe1.2
-0.019
tmem179b
0.109
gpx1a
-0.019
XLOC-015447
0.107
nt5c2l1
-0.019
cryaa
0.105
alas2
-0.019
eme2
0.105
epb41b
-0.019
urgcp
0.102
slc4a1a
-0.018
dhcr24
0.101
tmod4
-0.017
CR749752.1
0.096
pvalb1
-0.017
LOC103908890
0.096
zgc:163057
-0.017
CU302253.1
0.094
si:dkey-240n22.3
-0.016
XLOC-012652
0.092
si:ch211-207c6.2
-0.016
CU459145.1
0.092
gabarapa
-0.016
BX537249.1
0.092
tmem14ca
-0.016
crygm2d3
0.089
plac8l1
-0.016
calml4b
0.087
TCIM (1 of many)
-0.015
LOC108182241
0.084
nmt1b
-0.015
AL935044.2
0.084
si:ch211-227m13.1
-0.015
BX649490.3
0.081
mibp2
-0.014
kcnj1a.3
0.079
wasb
-0.013
CABZ01079267.1
0.079
hif1al2
-0.013
chrna10a
0.079
tbcelb
-0.013