Daniocell
zgc:165514 (fin)
zgc:165514
ZFIN
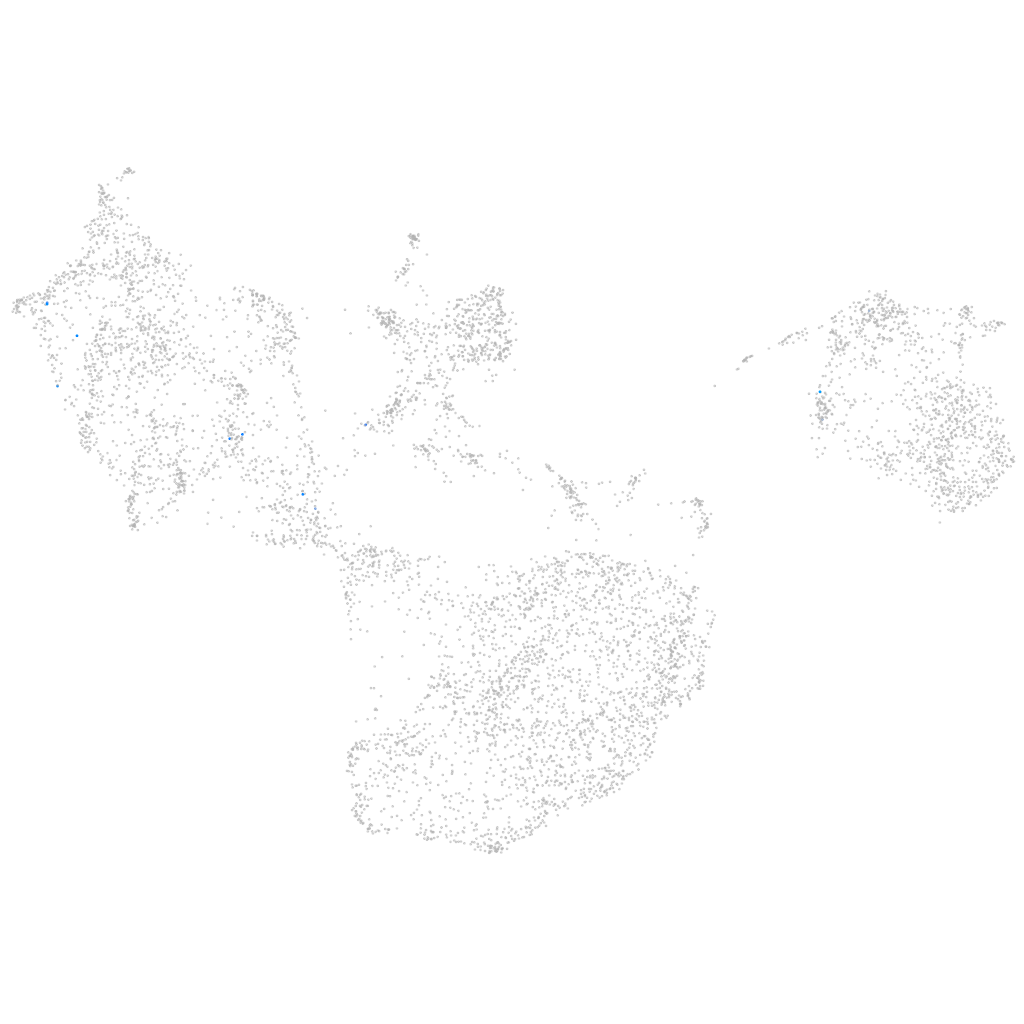
Gene expression UMAP
Display:
Expression
Stage
Other cell groups
all cells
blastomeres
PGCs
endoderm
axial mesoderm
muscle
mural cells /
non-skeletal muscle
mesenchyme
hematopoietic /
vasculature
pronephros
neural
spinal cord / glia
eye
taste / olfactory
otic / lateral line
epidermis
periderm
fin
ionocytes / mucous
pigment cells
Expression by stage/cluster
Correlated gene expression
Positive correlation
Negative correlation
Gene
r
Gene
r
LOC110440141
0.368
cldni
-0.041
znf1132
0.353
apoeb
-0.041
wdr27
0.311
and1
-0.037
si:rp71-1c10.10
0.259
si:dkey-248g15.3
-0.037
LOC103910850
0.257
cfl1l
-0.036
tdrd6
0.240
pleca
-0.035
gpr183a
0.202
cotl1
-0.035
qrfpra
0.201
tmsb1
-0.035
BX000451.1
0.185
and3
-0.035
znf1110
0.180
anxa1a
-0.034
AL954142.2
0.172
col18a1a
-0.034
abcc6b.2
0.158
ier2b
-0.034
si:dkey-46g23.5
0.153
tmem238a
-0.034
si:dkey-24p1.6
0.143
cldn1
-0.034
XLOC-032440
0.133
fmodb
-0.034
a2ml
0.133
hbegfa
-0.034
LOC101886524
0.131
bcam
-0.034
xxylt1
0.130
zgc:92380
-0.033
znf1111
0.127
tagln2
-0.033
dio2
0.125
s100a10b
-0.033
LOC103909293
0.124
egfl6
-0.033
XLOC-023979
0.123
pfn1
-0.032
ftr98
0.120
rac2
-0.032
BX005454.1
0.118
prr13
-0.032
CABZ01072563.1
0.112
f11r.1
-0.031
BX664721.3
0.108
si:ch1073-406l10.2
-0.031
CABZ01092170.1
0.108
and2
-0.031
ugt2a6
0.106
hhla2a.1
-0.031
LOC103910179
0.106
krt97
-0.031
wdpcp
0.105
epgn
-0.031
zgc:172339
0.104
cyt1
-0.031
XLOC-031211
0.104
cebpb
-0.031
slc22a5
0.103
si:ch211-264f5.6
-0.030
BX469885.1
0.101
tpm3
-0.030
chrna4b
0.098
hcls1
-0.030