Daniocell
zgc:165514 (pigment cells)
zgc:165514
ZFIN
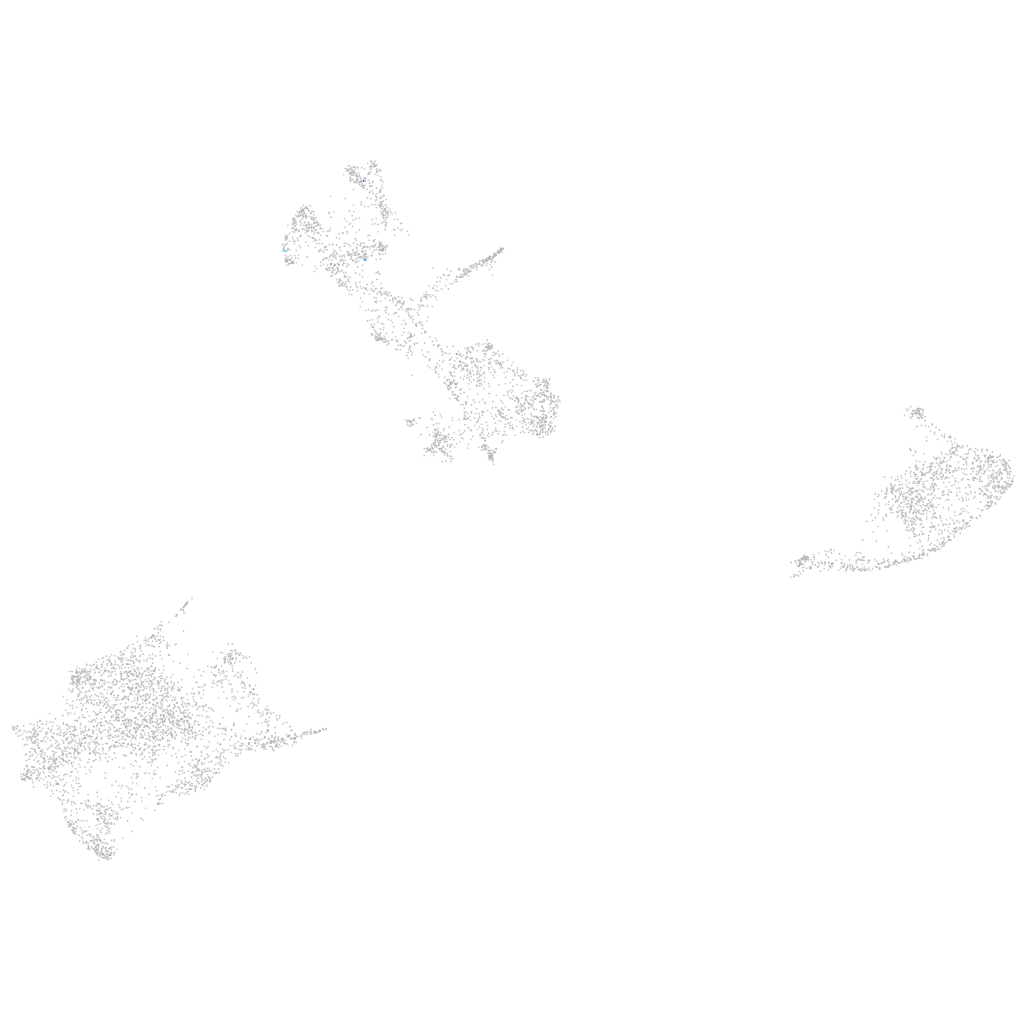
Gene expression UMAP
Display:
Expression
Stage
Other cell groups
all cells
blastomeres
PGCs
endoderm
axial mesoderm
muscle
mural cells /
non-skeletal muscle
mesenchyme
hematopoietic /
vasculature
pronephros
neural
spinal cord / glia
eye
taste / olfactory
otic / lateral line
epidermis
periderm
fin
ionocytes / mucous
pigment cells
Expression by stage/cluster
Correlated gene expression
Positive correlation
Negative correlation
Gene
r
Gene
r
cx28.8
0.502
gch2
-0.023
BX324213.1
0.367
CABZ01021592.1
-0.022
ccdc125
0.287
si:dkey-251i10.2
-0.020
LOC101884285
0.241
rpl23a
-0.019
si:ch211-113j14.1
0.239
cyt1
-0.019
PAMR1 (1 of many)
0.208
hbbe1.3
-0.018
ccl27b
0.197
hbae3
-0.018
CU682780.1
0.197
uraha
-0.017
XLOC-043122
0.195
cd63
-0.016
slc14a2
0.178
si:ch211-251b21.1
-0.015
nfil3-6
0.176
icn
-0.015
kcnip3b
0.173
zgc:110339
-0.015
ust
0.171
cyt1l
-0.015
tagapa
0.164
pts
-0.015
gdap1l1
0.162
aldob
-0.015
CU182823.2
0.152
tmem130
-0.015
thada
0.151
alas1
-0.014
FP103004.1
0.146
rtn1b
-0.014
aplnrb
0.141
hbbe1.1
-0.014
hsf2bp
0.140
cotl1
-0.014
clcnk
0.140
hbae1.1
-0.013
LOC110438360
0.138
si:ch211-194k22.8
-0.013
si:dkey-261e22.4
0.136
calm1a
-0.013
NPFFR2
0.136
s100a10b
-0.013
pgbd4
0.135
bscl2l
-0.013
apoa4b.2
0.135
si:dkey-151g10.6
-0.013
si:ch211-102c2.8
0.133
pfn1
-0.013
magi2b
0.133
si:dkey-56m19.5
-0.013
si:ch73-43g23.1
0.129
tnni2a.4
-0.012
pdcb
0.126
gpd1b
-0.012
inpp4b
0.125
aox5
-0.012
DSG2
0.124
actc1b
-0.012
LOC793824
0.124
rbp4l
-0.012
znf1159
0.124
aqp3a
-0.012
mcm10
0.123
prdx5
-0.012