Daniocell
zgc:165514 (muscle)
zgc:165514
ZFIN
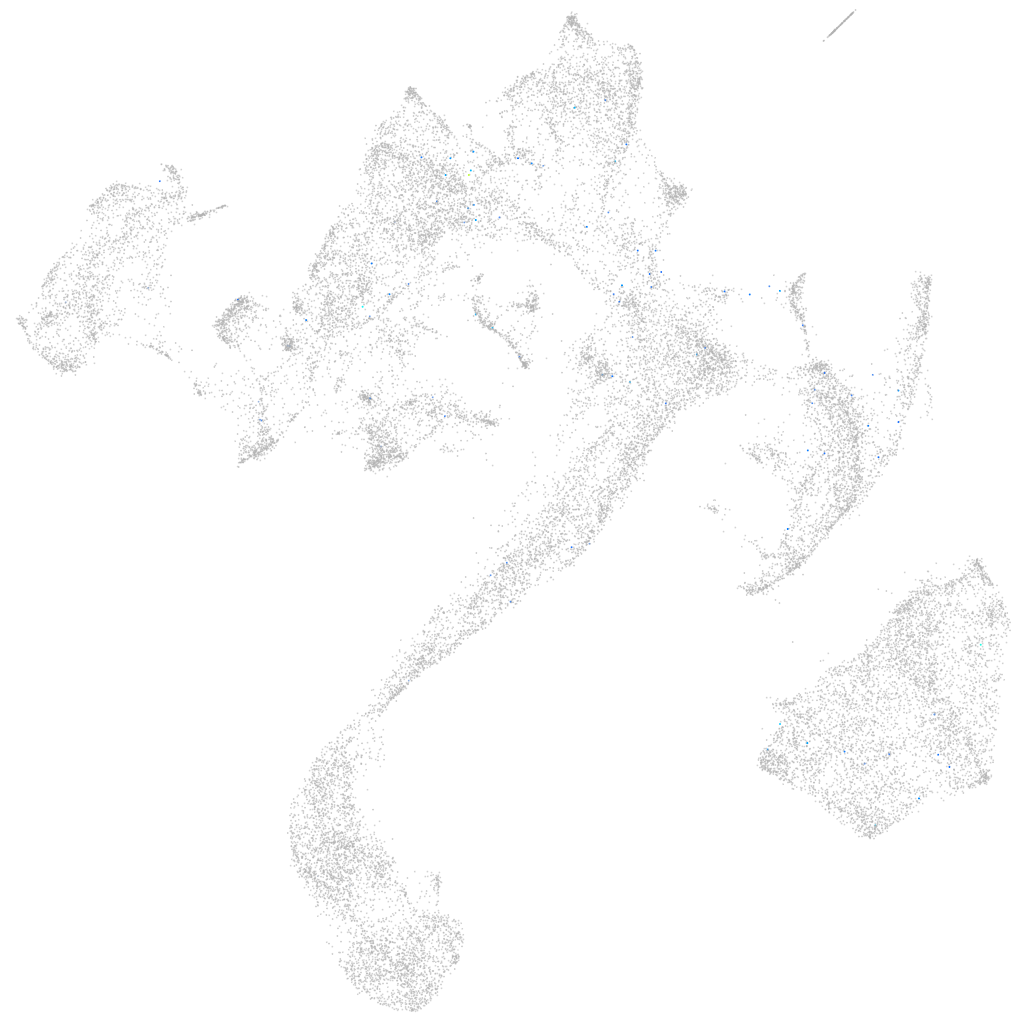
Gene expression UMAP
Display:
Expression
Stage
Other cell groups
all cells
blastomeres
PGCs
endoderm
axial mesoderm
muscle
mural cells /
non-skeletal muscle
mesenchyme
hematopoietic /
vasculature
pronephros
neural
spinal cord / glia
eye
taste / olfactory
otic / lateral line
epidermis
periderm
fin
ionocytes / mucous
pigment cells
Expression by stage/cluster
Correlated gene expression
Positive correlation
Negative correlation
Gene
r
Gene
r
pimr83
0.158
aldoab
-0.025
XLOC-001768
0.153
actc1b
-0.025
BX005398.1
0.117
ckmb
-0.024
XLOC-039623
0.098
ak1
-0.024
si:dkey-27h10.2
0.090
ckma
-0.024
LOC103911178
0.090
ttn.1
-0.024
BX927260.1
0.089
atp2a1
-0.024
si:dkey-71l4.2
0.086
neb
-0.023
CT583652.1
0.081
ldb3b
-0.023
ccdc87
0.078
tnnc2
-0.023
LOC103909570
0.078
si:ch73-367p23.2
-0.023
apoa4b.2
0.075
gapdh
-0.023
LOC110437749
0.069
smyd1a
-0.022
BX088594.1
0.065
ttn.2
-0.022
rpe65c
0.065
actn3a
-0.022
XLOC-017492
0.064
ldb3a
-0.022
zgc:195077
0.063
tmem38a
-0.022
cfap161
0.059
myom1a
-0.022
si:dkey-240h12.4
0.059
XLOC-005350
-0.022
si:ch211-125e6.13
0.058
actn3b
-0.021
c1ql4b
0.057
tpma
-0.021
XLOC-000910
0.056
CABZ01078594.1
-0.021
nrn1b
0.056
mylpfa
-0.021
zgc:162509
0.053
casq2
-0.021
zdhhc21.1
0.053
pvalb2
-0.021
OSCP1 (1 of many)
0.053
hhatla
-0.021
si:dkey-238d18.5
0.052
rtn1a
-0.021
LOC110438150
0.052
acta1b
-0.021
BX510920.1
0.051
pgam2
-0.021
si:ch211-223g7.2
0.051
mylz3
-0.021
zgc:175135
0.051
tmod4
-0.021
LOC101882326
0.050
tnni2a.4
-0.020
LOC101884756
0.049
srl
-0.020
ccr11.1
0.049
prr33
-0.020
treh
0.049
pvalb1
-0.020