Daniocell
zgc:165514 (neural)
zgc:165514
ZFIN
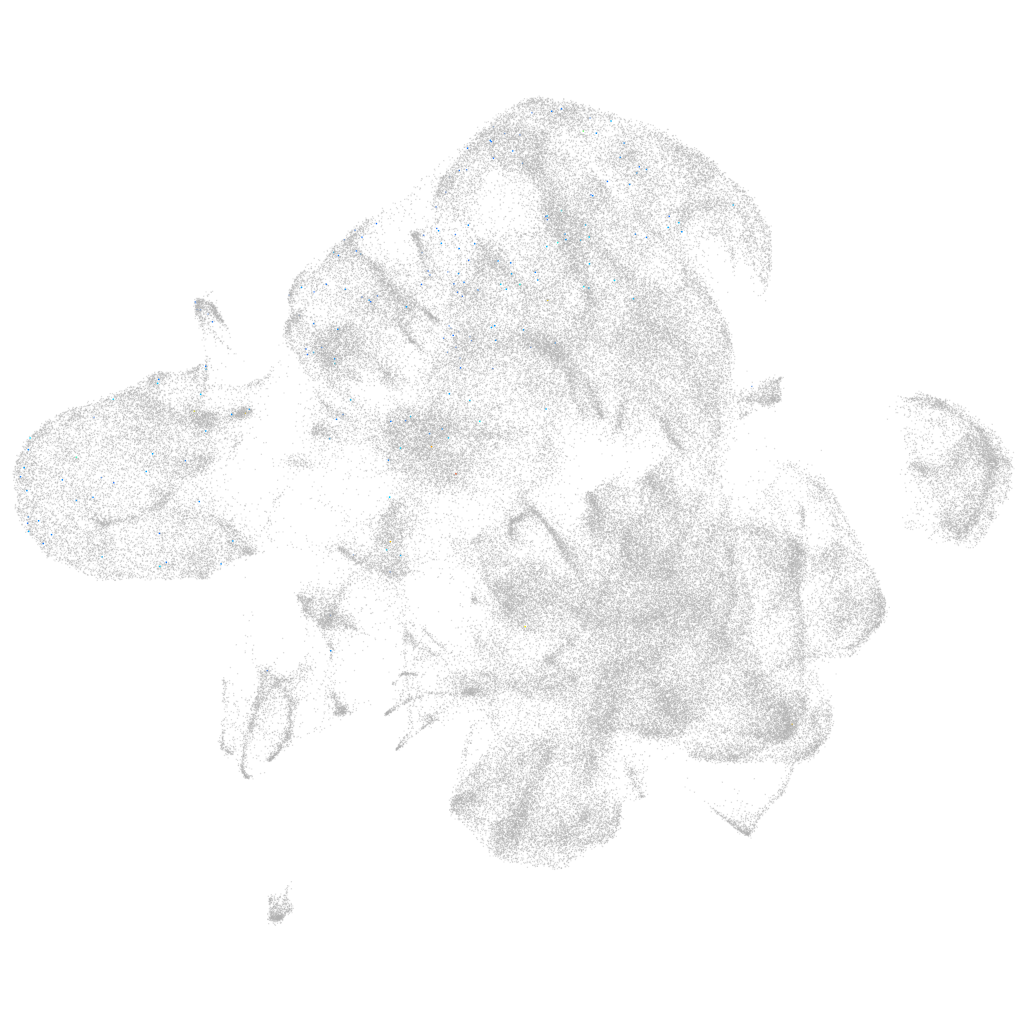
Gene expression UMAP
Display:
Expression
Stage
Other cell groups
all cells
blastomeres
PGCs
endoderm
axial mesoderm
muscle
mural cells /
non-skeletal muscle
mesenchyme
hematopoietic /
vasculature
pronephros
neural
spinal cord / glia
eye
taste / olfactory
otic / lateral line
epidermis
periderm
fin
ionocytes / mucous
pigment cells
Expression by stage/cluster
Correlated gene expression
Positive correlation
Negative correlation
Gene
r
Gene
r
LOC101882750
0.133
rtn1a
-0.029
si:ch211-198o12.4
0.131
stmn1b
-0.028
BX927082.1
0.110
elavl3
-0.026
rbm46
0.095
ptmaa
-0.026
vmo1a
0.093
tuba1c
-0.025
si:dkey-62k3.6
0.081
ckbb
-0.024
LOC110440211
0.067
gng3
-0.022
LOC100538255
0.065
gpm6ab
-0.022
LOC101882729
0.061
gpm6aa
-0.022
ppp1r27b
0.060
sncb
-0.022
LOC103910826
0.058
atp6v0cb
-0.021
LOC101882334
0.053
hmgb3a
-0.021
nanos3
0.050
CR383676.1
-0.021
adgre8
0.050
rnasekb
-0.021
BX530017.1
0.049
tmsb
-0.021
LOC101884392
0.049
rtn1b
-0.021
LOC101882645
0.048
elavl4
-0.020
si:dkey-3p4.1
0.044
vamp2
-0.020
zgc:171517
0.044
fez1
-0.020
LOC101882559
0.043
si:dkeyp-75h12.5
-0.020
si:ch211-239d6.2
0.043
myt1b
-0.019
zgc:152857
0.041
calm1a
-0.019
CABZ01024844.1
0.039
stx1b
-0.019
zgc:162509
0.036
stmn2a
-0.019
BX294388.1
0.034
nova2
-0.019
CABZ01033206.1
0.033
si:dkey-276j7.1
-0.018
nudt19
0.033
ywhag2
-0.018
kif1cl
0.033
stxbp1a
-0.018
CT025776.2
0.032
pvalb2
-0.018
bard1
0.032
tubb5
-0.018
pcna
0.032
zgc:65894
-0.018
mir199-2
0.031
gng2
-0.018
rfc4
0.031
gap43
-0.018
ankrd50l
0.030
jpt1b
-0.017
XLOC-003718
0.030
myt1a
-0.017