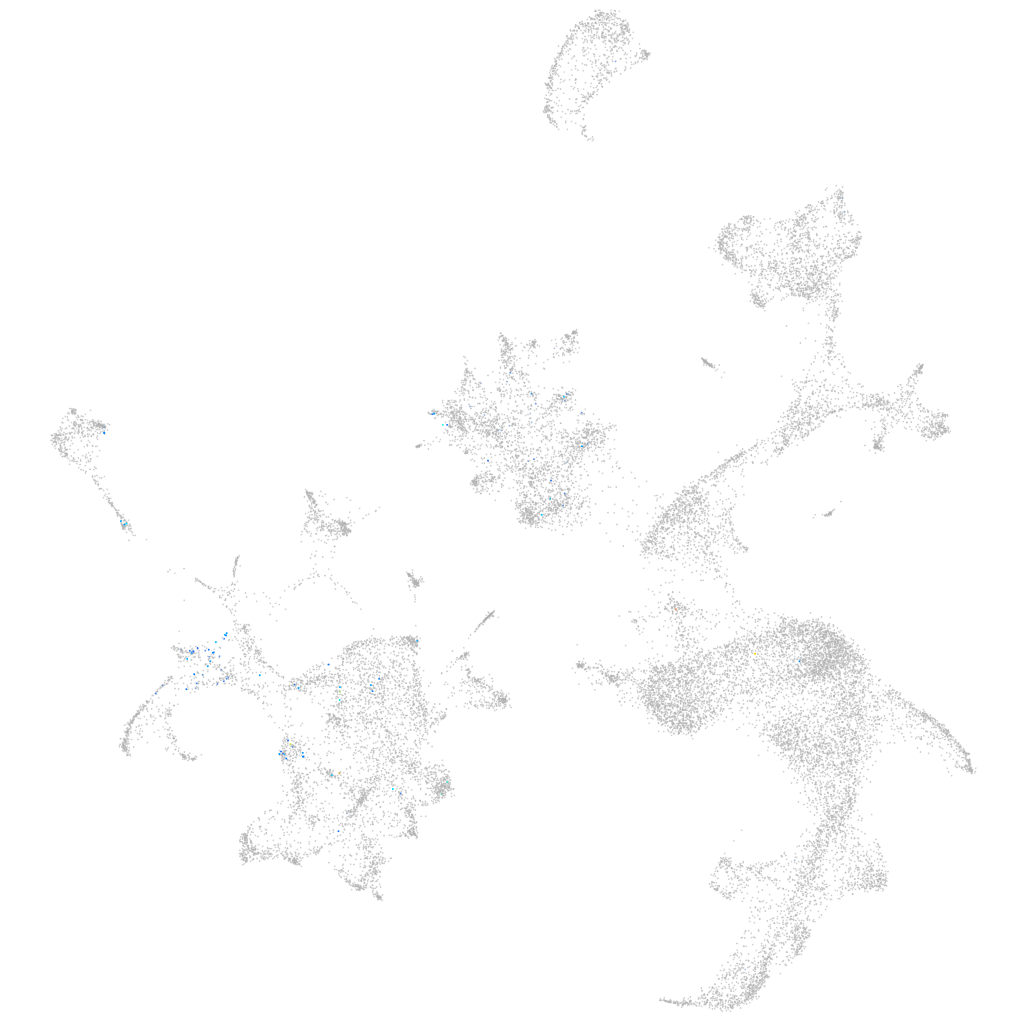
Daniocell
hoxb8b (hematopoietic / vasculature)
homeobox B8b
ZFIN
Gene expression UMAP
Display:
Expression
Stage
Other cell groups
all cells
blastomeres
PGCs
endoderm
axial mesoderm
muscle
mural cells /
non-skeletal muscle
mesenchyme
hematopoietic /
vasculature
pronephros
neural
spinal cord / glia
eye
taste / olfactory
otic / lateral line
epidermis
periderm
fin
ionocytes / mucous
pigment cells
Expression by stage/cluster
Correlated gene expression
Positive correlation
Negative correlation
Gene
r
Gene
r
CABZ01085195.1
0.132
prdx2
-0.041
BX548024.1
0.130
blvrb
-0.037
hoxc3a
0.125
hbae1.1
-0.037
LOC110438405
0.121
hbae3
-0.035
CABZ01010830.1
0.120
hbbe1.3
-0.035
hoxb8a
0.120
hemgn
-0.033
CABZ01083945.1
0.119
hbae1.3
-0.033
hoxb7a
0.108
cahz
-0.033
CU210919.1
0.107
hbbe1.1
-0.033
si:ch211-218m3.9
0.106
hbbe2
-0.032
hoxb10a
0.105
tspo
-0.032
LOC101885765
0.104
tmem14ca
-0.031
LOC103910749
0.104
alas2
-0.030
LOC100329825
0.103
zgc:163057
-0.030
LOC110438359
0.102
hbbe1.2
-0.030
LOC103911081
0.101
gpx1a
-0.028
LOC108190012
0.101
slc4a1a
-0.027
hoxb9a
0.101
pvalb1
-0.027
LOC103910009
0.101
si:ch211-207c6.2
-0.027
hoxc8a
0.095
nt5c2l1
-0.026
XLOC-018430
0.093
nmt1b
-0.026
CR628341.1
0.091
mbnl1
-0.026
mir219-1
0.091
tmod4
-0.025
UST
0.091
selenoj
-0.025
hoxc6b
0.090
hdr
-0.025
lrig3.2
0.090
creg1
-0.025
BX001014.2
0.089
urod
-0.023
BX469925.3
0.088
sod1
-0.023
BX005124.1
0.087
fth1a
-0.023
emilin2b
0.086
mibp2
-0.023
mnx1
0.085
laptm5
-0.022
BX928743.1
0.084
tfr1a
-0.022
si:ch211-153b23.3
0.083
pvalb2
-0.022
lsp1
0.082
uros
-0.022
hoxb1b
0.081
hbae5
-0.022