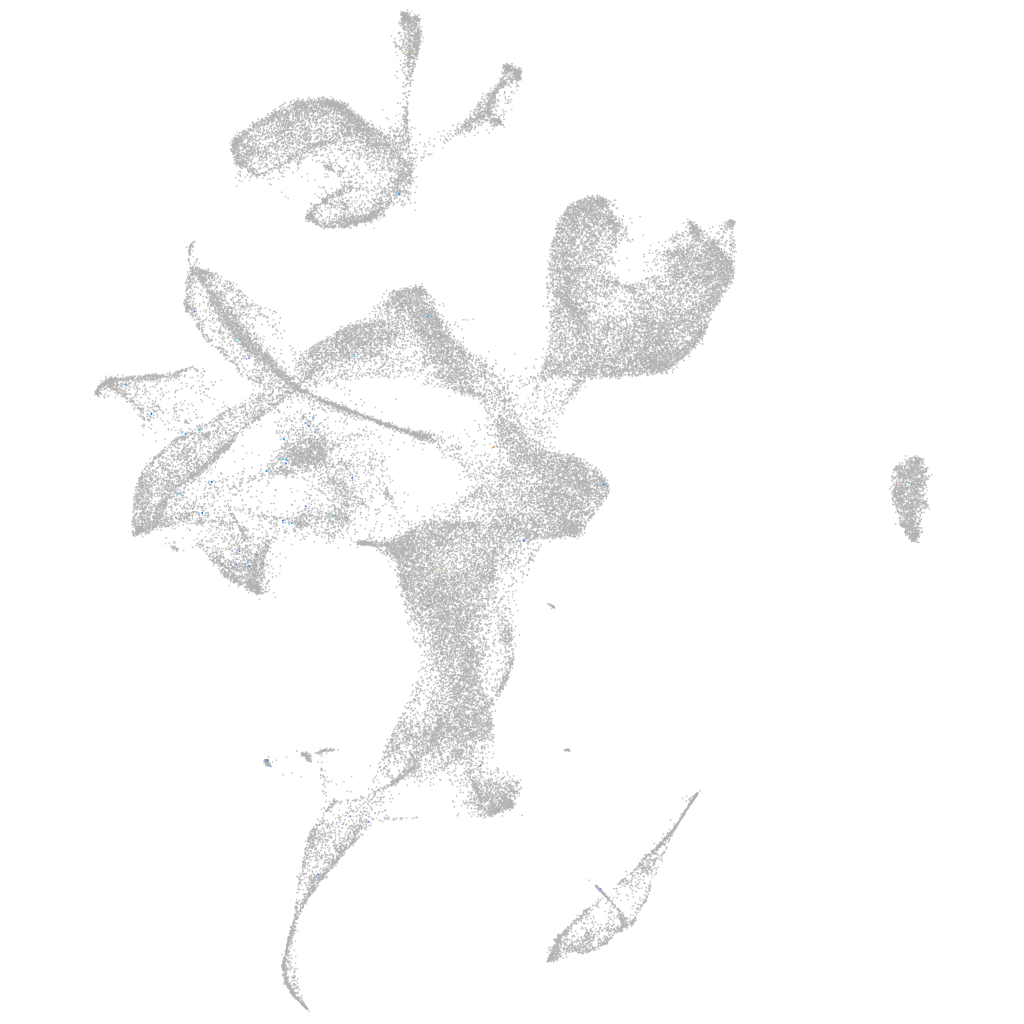
Daniocell
hoxb8b (eye)
homeobox B8b
ZFIN
Gene expression UMAP
Display:
Expression
Stage
Other cell groups
all cells
blastomeres
PGCs
endoderm
axial mesoderm
muscle
mural cells /
non-skeletal muscle
mesenchyme
hematopoietic /
vasculature
pronephros
neural
spinal cord / glia
eye
taste / olfactory
otic / lateral line
epidermis
periderm
fin
ionocytes / mucous
pigment cells
Expression by stage/cluster
Correlated gene expression
Positive correlation
Negative correlation
Gene
r
Gene
r
XLOC-024285
0.194
COX3
-0.013
si:dkeyp-82a1.4
0.167
rorab
-0.010
hoxb8a
0.162
neurod4
-0.010
hoxb6a
0.134
bcl2l10
-0.009
hoxb6b
0.120
smarca4a
-0.009
hoxc3a
0.119
ubc
-0.009
gdf7
0.116
zgc:153409
-0.009
BX088524.2
0.112
vdac1
-0.009
LOC108179710
0.099
ncalda
-0.009
sim1a
0.096
myca
-0.009
hoxb5a
0.094
hnrnpa1a
-0.008
mir196b
0.092
mid1ip1l
-0.008
ftr04
0.090
cspg5b
-0.008
XLOC-011119
0.087
si:ch211-13k12.2
-0.008
si:dkey-59l11.10
0.086
bhlhe23
-0.008
LOC103910107
0.077
gtf2f2a
-0.008
AL929294.1
0.076
cnot2
-0.008
hoxb7a
0.074
srsf6b
-0.008
si:ch211-119c20.2
0.074
lin7a
-0.008
cabcoco1
0.072
cadm3
-0.008
hoxb5b
0.070
stx6
-0.008
hoxc8a
0.068
six3b
-0.008
hoxb3a
0.068
brd3a
-0.008
AL929378.1
0.068
dab1b
-0.008
hoxb9a
0.068
gclc
-0.008
si:dkey-196j8.2
0.059
si:ch1073-83n3.2
-0.007
epha4l
0.059
cnrip1b
-0.007
LOC108181189
0.059
fam208b
-0.007
LOC108181454
0.059
atp5fa1
-0.007
LOC101886621
0.058
snrpf
-0.007
pth1b
0.058
bcap31
-0.007
pdlim3b
0.057
gins4
-0.007
hoxc5a
0.056
vsx1
-0.007
hoxa3a
0.056
pcp4l1
-0.007
LOC100537585
0.056
sfrp1a
-0.007