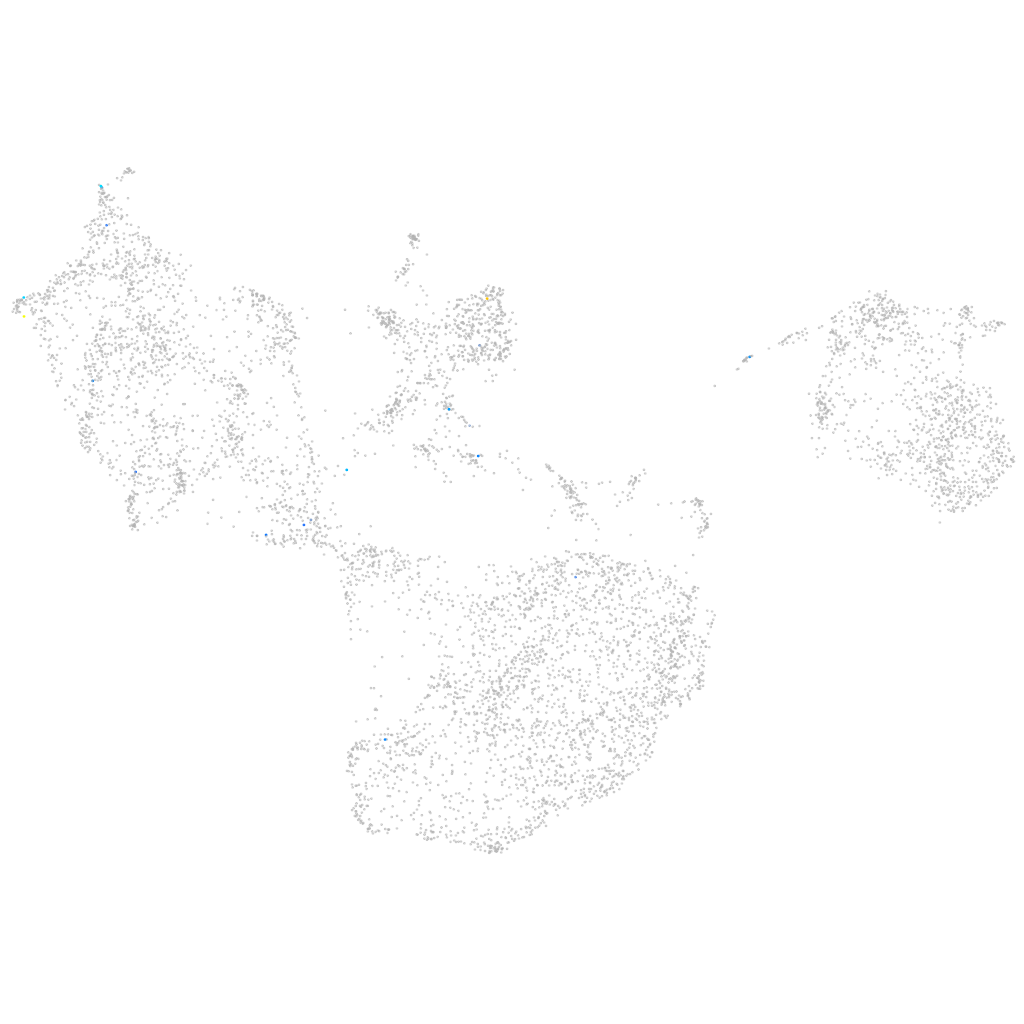
Daniocell
hoxb8b (fin)
homeobox B8b
ZFIN
Gene expression UMAP
Display:
Expression
Stage
Other cell groups
all cells
blastomeres
PGCs
endoderm
axial mesoderm
muscle
mural cells /
non-skeletal muscle
mesenchyme
hematopoietic /
vasculature
pronephros
neural
spinal cord / glia
eye
taste / olfactory
otic / lateral line
epidermis
periderm
fin
ionocytes / mucous
pigment cells
Expression by stage/cluster
Correlated gene expression
Positive correlation
Negative correlation
Gene
r
Gene
r
pimr83
0.410
id1
-0.050
pimr80
0.362
cldni
-0.043
ca14
0.360
si:dkey-112e7.2
-0.042
LOC108192140
0.344
s100a10b
-0.042
si:dkey-193b15.8
0.297
pfn1
-0.042
XLOC-024206
0.278
cfl1l
-0.042
LOC101885178
0.275
cyt1
-0.042
plvapa
0.272
anxa1a
-0.041
hoxa5a
0.270
tmsb1
-0.040
BX465208.1
0.263
aqp3a
-0.040
tbkbp1
0.260
arhgdig
-0.039
si:ch211-117n7.7
0.259
epcam
-0.039
col27a1a
0.255
wbp2nl
-0.039
si:ch211-79h18.2
0.246
wu:fb18f06
-0.038
kctd16a
0.244
selenow1
-0.038
CR847844.1
0.239
cldn1
-0.038
RUNDC1
0.220
egfl6
-0.037
LOC110438150
0.219
pnp5a
-0.037
csf1ra
0.210
cotl1
-0.037
pimr129
0.210
pycard
-0.036
LOC101883751
0.208
hbegfa
-0.036
BX901974.1
0.207
ecrg4b
-0.036
lrp1bb
0.203
krt4
-0.035
BX649416.2
0.201
si:dkey-248g15.3
-0.035
BX890539.1
0.200
zgc:86896
-0.035
acer3
0.199
apoeb
-0.035
fam43b
0.192
dlx3b
-0.035
zgc:112183
0.189
pak2a
-0.035
enpp4
0.189
epgn
-0.034
si:dkey-47k20.8
0.186
arpc4
-0.034
si:dkey-81p22.11
0.185
si:ch211-264f5.6
-0.034
col19a1
0.185
rac2
-0.034
BX927308.2
0.183
and2
-0.034
zgc:158445
0.179
arpc5b
-0.034
SLC29A4 (1 of many)
0.179
myh9a
-0.034