Daniocell
si:ch211-255f4.9 (ionocytes / mucous-producing)
si:ch211-255f4.9
ZFIN
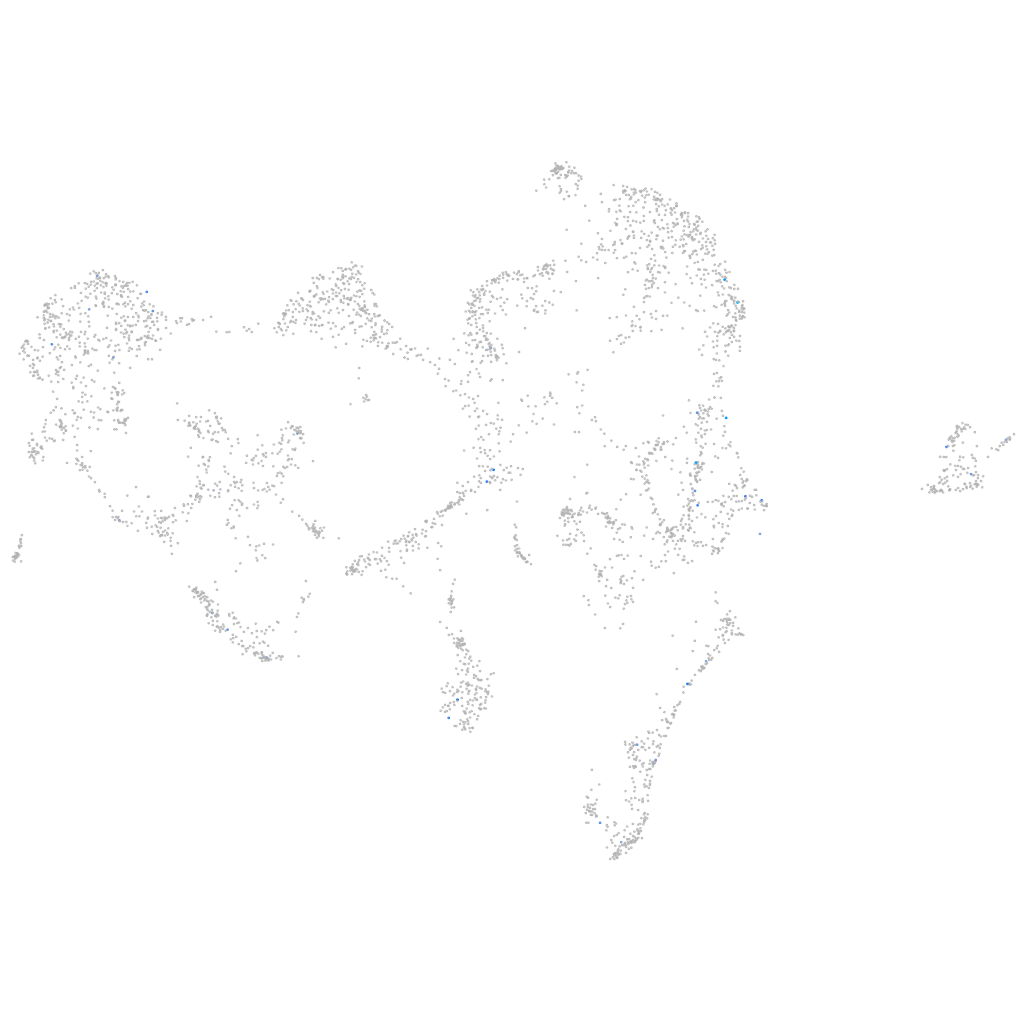
Gene expression UMAP
Display:
Expression
Stage
Other cell groups
all cells
blastomeres
PGCs
endoderm
axial mesoderm
muscle
mural cells /
non-skeletal muscle
mesenchyme
hematopoietic /
vasculature
pronephros
neural
spinal cord / glia
eye
taste / olfactory
otic / lateral line
epidermis
periderm
fin
ionocytes / mucous
pigment cells
Expression by stage/cluster
Correlated gene expression
Positive correlation
Negative correlation
Gene
r
Gene
r
LOC101886371
0.281
egr1
-0.048
LOC101885705
0.228
mt-co2
-0.047
znf1060
0.223
COX3
-0.046
si:ch73-170d6.4
0.218
zgc:158463
-0.043
lgsn
0.209
litaf
-0.042
ftr69
0.206
rplp2
-0.042
XLOC-042909
0.204
ezrb
-0.039
cideb
0.200
nfe2l2a
-0.038
BX640522.2
0.187
soul2
-0.038
gdpd3b
0.183
si:dkey-193p11.2
-0.038
CR926130.2
0.178
mt-nd3
-0.037
BX511184.1
0.178
mt-atp6
-0.037
cmtm8a
0.177
pvalb1
-0.037
LOC103908707
0.172
zgc:85777
-0.037
ugt2a3
0.172
dusp2
-0.036
si:ch211-11c3.12
0.171
si:ch211-195e19.1
-0.036
BX901883.2
0.171
ppp2r1ba
-0.036
si:dkey-288i20.2
0.166
acadl
-0.035
wnt5a
0.164
tnip1
-0.035
mir457b
0.160
b2ml
-0.034
grn2
0.155
myo1cb
-0.034
si:dkey-172k15.6
0.155
ndufa12
-0.034
rapgefl1
0.150
NDUFB1
-0.034
zgc:165539
0.150
suclg2
-0.033
si:dkey-103g5.4
0.144
atxn1a
-0.033
cln6b
0.143
znf704
-0.033
BX248243.1
0.143
rgs5b
-0.033
LOC101883600
0.140
tbc1d4
-0.032
uts2d
0.139
itsn2b
-0.032
zgc:113096
0.137
atp1a1a.2
-0.032
ccdc33
0.135
sptbn2
-0.032
CABZ01040054.1
0.133
sod2
-0.032
nrn1b
0.133
atp1b1b
-0.032
LOC103911204
0.131
gsto2
-0.032
tgm8
0.130
fbp1a
-0.032