Daniocell
si:ch211-255f4.9 (taste / olfactory)
si:ch211-255f4.9
ZFIN
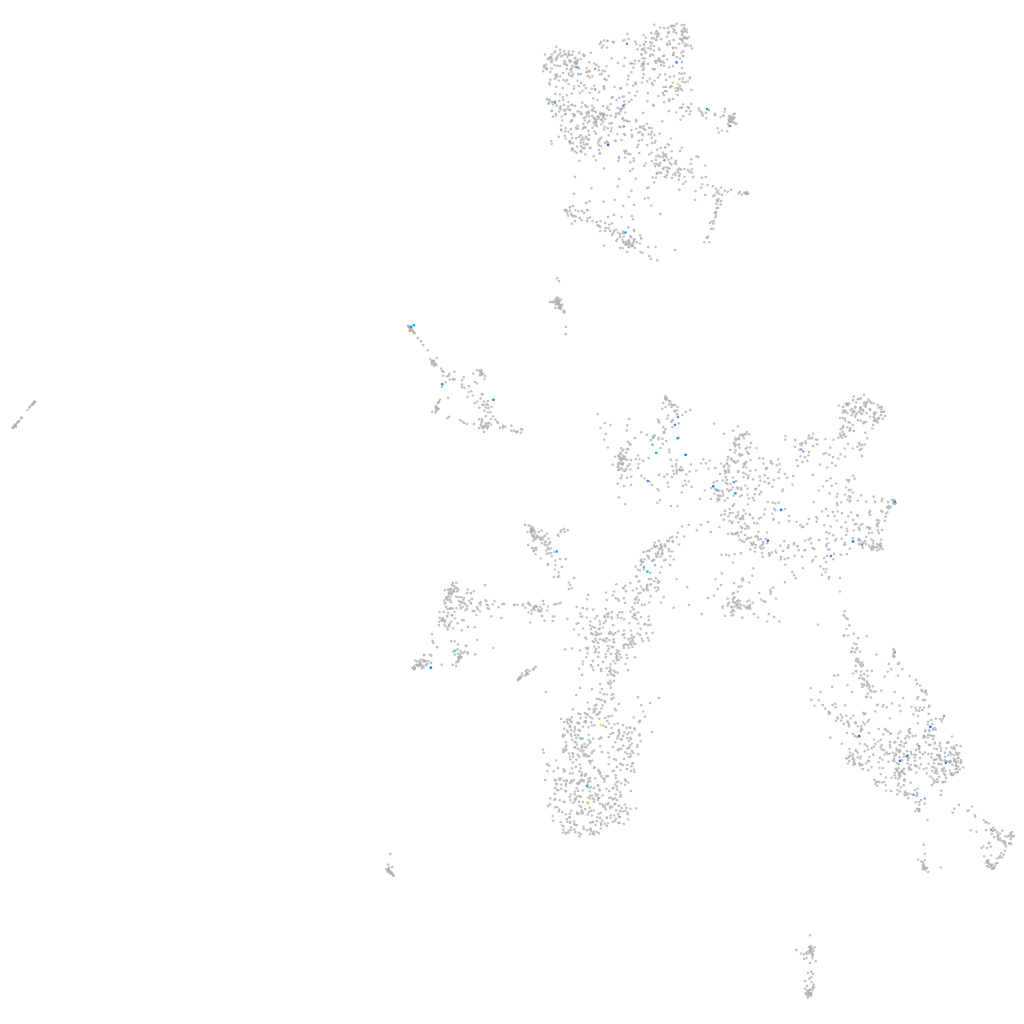
Gene expression UMAP
Display:
Expression
Stage
Other cell groups
all cells
blastomeres
PGCs
endoderm
axial mesoderm
muscle
mural cells /
non-skeletal muscle
mesenchyme
hematopoietic /
vasculature
pronephros
neural
spinal cord / glia
eye
taste / olfactory
otic / lateral line
epidermis
periderm
fin
ionocytes / mucous
pigment cells
Expression by stage/cluster
Correlated gene expression
Positive correlation
Negative correlation
Gene
r
Gene
r
LOC110438475
0.322
uqcrq
-0.044
fam78aa
0.319
mt-nd5
-0.040
SAMD5
0.316
mrps21
-0.038
cacna1sa
0.247
mt-co1
-0.038
si:dkey-19b23.10
0.242
ncbp2
-0.038
sall1b
0.232
si:ch211-39i22.1
-0.037
si:dkey-21e13.3
0.214
NDUFB1
-0.037
FP016208.1
0.204
tmem199
-0.036
BX649434.2
0.197
coa3a
-0.036
cavin4a
0.188
gpx1b
-0.035
opn9
0.188
sypa
-0.035
impg1a
0.180
larp4ab
-0.035
crygmx
0.178
CABZ01113812.1
-0.035
crygm2d1
0.178
hmgcl
-0.035
CU856358.1
0.175
tmem59
-0.035
zfpm1
0.174
mau2
-0.035
gpx2
0.174
wu:fb18f06
-0.034
rasip1
0.173
prpf39
-0.034
si:dkey-33m11.8
0.168
psat1
-0.034
XLOC-039647
0.167
ccnt2b
-0.034
si:ch73-274k23.1
0.166
ift27
-0.034
LOC101884692
0.163
flot2a
-0.034
XLOC-042219
0.160
txn2
-0.033
LOC110437922
0.159
ubxn1
-0.033
ecel1
0.158
spen
-0.032
mamdc2b
0.156
mns1
-0.032
LOC103909053
0.154
emx2
-0.032
FP236734.1
0.151
zgc:175088
-0.032
si:dkeyp-72e1.9
0.147
si:dkey-250d21.1
-0.032
gata4
0.147
cep83
-0.032
oc90
0.146
mbnl2
-0.031
FP085399.1
0.146
si:ch211-218c6.8
-0.031
XLOC-043852
0.146
nip7
-0.031
ccr6b
0.146
mfap1
-0.031
rln3a
0.145
LO017848.1
-0.031