Daniocell
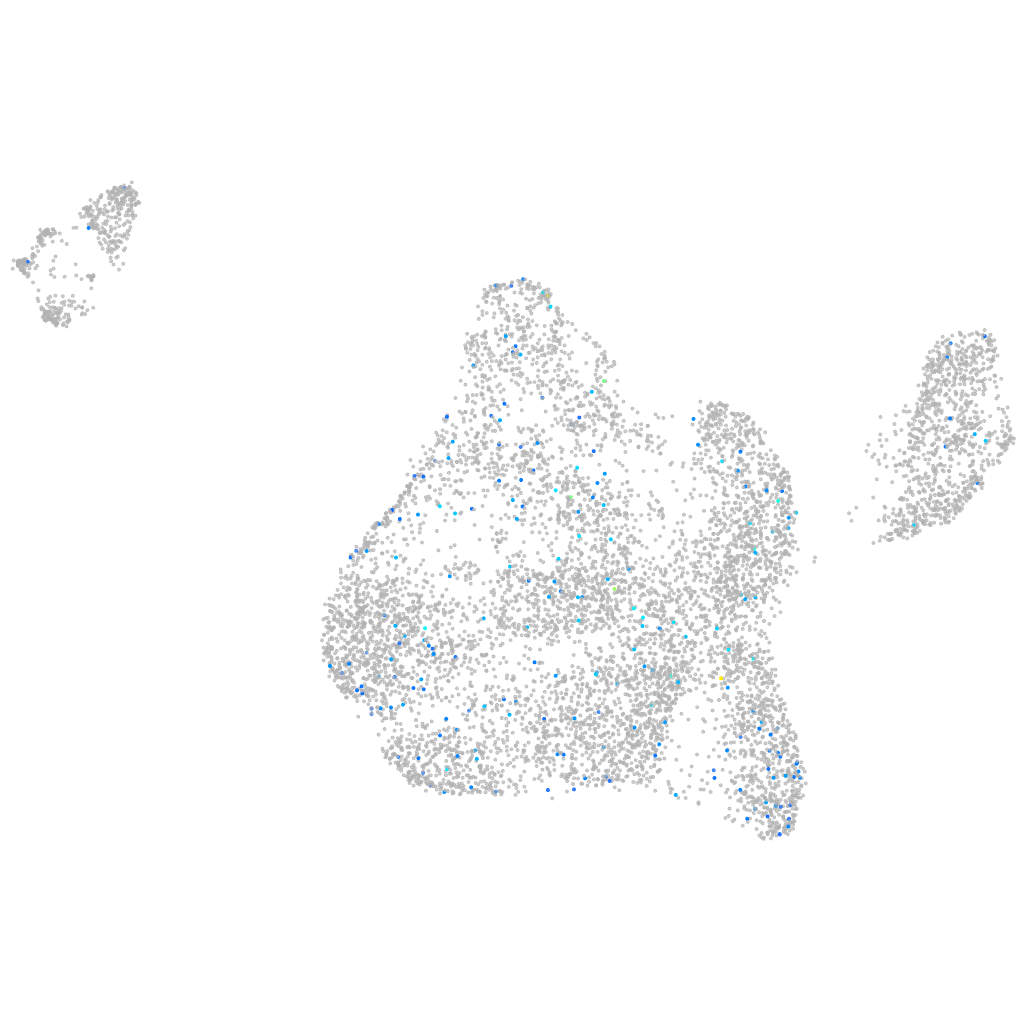
si:ch211-255f4.9 (blastomeres)
si:ch211-255f4.9
ZFIN
Gene expression UMAP
Display:
Expression
Stage
Other cell groups
all cells
blastomeres
PGCs
endoderm
axial mesoderm
muscle
mural cells /
non-skeletal muscle
mesenchyme
hematopoietic /
vasculature
pronephros
neural
spinal cord / glia
eye
taste / olfactory
otic / lateral line
epidermis
periderm
fin
ionocytes / mucous
pigment cells
Expression by stage/cluster
Correlated gene expression
Positive correlation
Negative correlation
Gene
r
Gene
r
LOC103911209
0.133
ccna1
-0.048
LOC100332639
0.111
nanog
-0.043
BX324003.2
0.102
spink2.1
-0.042
arxb
0.091
cth1
-0.042
gabbr2
0.089
map7d1a
-0.039
LOC103910566
0.087
pabpn1l
-0.038
clca1
0.085
si:ch211-214j24.10
-0.037
ptpro
0.083
h2af1al
-0.037
LOC108183933
0.079
slc25a25a
-0.037
LOC103909114
0.079
klhl18
-0.037
si:dkey-93h22.7
0.076
csnk1g2a
-0.036
AL844192.1
0.076
mid1ip1l
-0.036
LOC101883959
0.074
zgc:55461
-0.036
kncn
0.072
zc3h7bb
-0.035
XLOC-012418
0.071
ell2
-0.035
camkk1b
0.071
bora
-0.035
LO018493.2
0.071
tab2
-0.034
LOC108179296
0.070
uchl1
-0.034
si:ch211-234h8.7
0.070
zp3d.1
-0.034
XLOC-011133
0.070
acp5a
-0.034
BX469908.1
0.068
tmub1
-0.034
fam19a4b
0.068
fbxo45
-0.034
slc24a4b
0.068
si:dkeyp-34c12.1
-0.034
CU972454.1
0.067
zgc:173742
-0.034
LOC108183756
0.067
ccdc124
-0.033
znfl1c
0.064
manf
-0.033
hunk
0.062
wee2
-0.033
slc44a5a
0.062
rab13
-0.033
AL953907.1
0.062
tob1b
-0.033
CR925709.2
0.062
hmgcs1
-0.033
XLOC-005432
0.062
her5
-0.033
LOC103910428
0.062
plekha1a
-0.033
ahrrb
0.062
pi4k2b
-0.033
LOC103910488
0.061
zgc:123010
-0.033
BX601644.4
0.060
rbm15
-0.033