Daniocell
si:ch211-255f4.9 (mesenchyme)
si:ch211-255f4.9
ZFIN
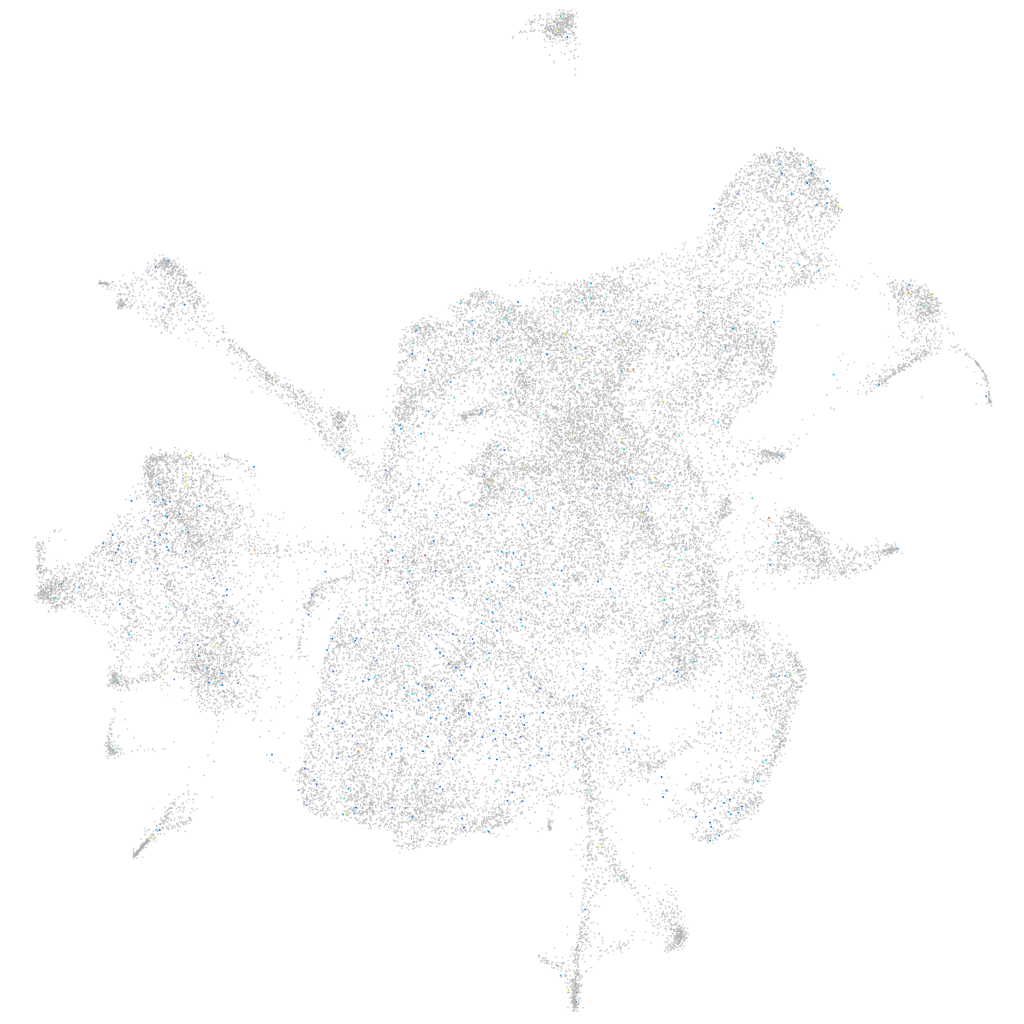
Gene expression UMAP
Display:
Expression
Stage
Other cell groups
all cells
blastomeres
PGCs
endoderm
axial mesoderm
muscle
mural cells /
non-skeletal muscle
mesenchyme
hematopoietic /
vasculature
pronephros
neural
spinal cord / glia
eye
taste / olfactory
otic / lateral line
epidermis
periderm
fin
ionocytes / mucous
pigment cells
Expression by stage/cluster
Correlated gene expression
Positive correlation
Negative correlation
Gene
r
Gene
r
si:ch211-229c8.13
0.083
myhz1.1
-0.015
CABZ01072084.1
0.069
col2a1b
-0.014
LOC101884296
0.068
mir214a
-0.013
SLC5A7
0.066
col11a1b
-0.013
rxfp2b
0.064
surf4l
-0.013
XLOC-035750
0.060
wfdc2
-0.012
si:ch73-223p23.2
0.059
col5a1
-0.012
LOC110439795.1
0.058
col9a2
-0.012
LOC110438117
0.053
rhag
-0.012
BX324212.1
0.052
tnn
-0.012
CABZ01078606.1
0.051
matn4
-0.012
cuzd1.2
0.051
col9a1a
-0.012
LOC101882470
0.048
slc43a3b
-0.012
CU467042.1
0.048
zgc:113307
-0.012
or128-6
0.047
XLOC-025423
-0.011
AL954861.1
0.047
nfatc3a
-0.011
CABZ01003476.1
0.044
ednraa
-0.011
LOC100536119
0.043
rpl29
-0.011
LOC110438157
0.043
fbxw5
-0.011
phf1
0.042
fgl1
-0.011
LOC100005685
0.042
slc41a2b
-0.011
BX005005.1
0.042
col1a2
-0.011
spic
0.042
cdh11
-0.011
LOC101886743
0.041
ngfra
-0.011
BX901898.2
0.041
zgc:171679
-0.011
BX649384.2
0.041
pmp22b
-0.011
si:dkey-238d18.5
0.041
nr1d2b
-0.011
LOC103909209
0.040
mrpl28
-0.011
LOC110440019
0.039
col1a1b
-0.011
si:dkey-226n24.1
0.039
bckdk
-0.010
masp2
0.039
tnc
-0.010
XLOC-007662
0.038
sparc
-0.010
si:ch211-197l9.5
0.038
cd82a
-0.010
znf1029
0.037
col1a1a
-0.010
BX000463.2
0.037
lmcd1
-0.010