Daniocell
si:ch211-255f4.9 (endoderm)
si:ch211-255f4.9
ZFIN
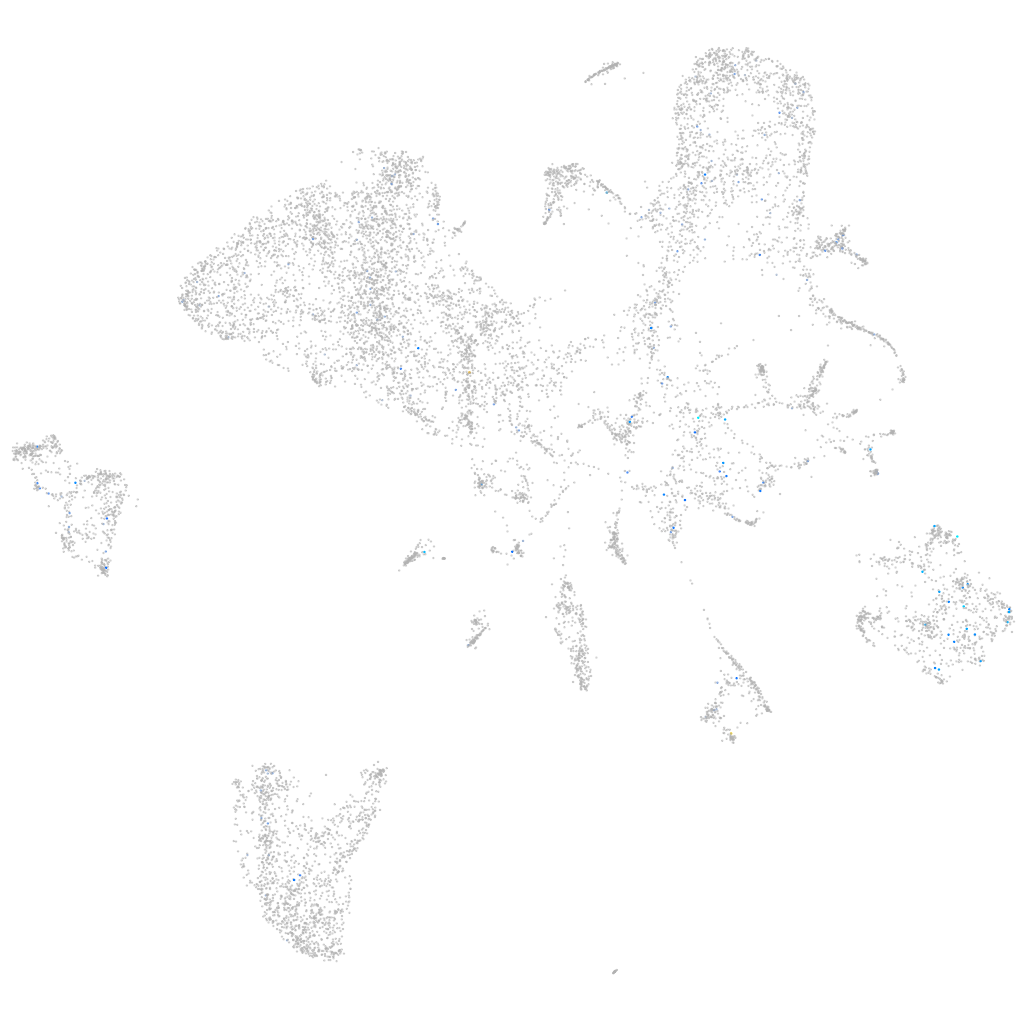
Gene expression UMAP
Display:
Expression
Stage
Other cell groups
all cells
blastomeres
PGCs
endoderm
axial mesoderm
muscle
mural cells /
non-skeletal muscle
mesenchyme
hematopoietic /
vasculature
pronephros
neural
spinal cord / glia
eye
taste / olfactory
otic / lateral line
epidermis
periderm
fin
ionocytes / mucous
pigment cells
Expression by stage/cluster
Correlated gene expression
Positive correlation
Negative correlation
Gene
r
Gene
r
prl
0.212
gamt
-0.051
si:dkey-22a18.2
0.203
ahcy
-0.049
XLOC-043654
0.203
bhmt
-0.048
smtla
0.188
gapdh
-0.048
LOC100534780
0.181
zgc:92744
-0.047
NC-002333.13
0.175
gpx4a
-0.045
wnt8b
0.158
apoa1b
-0.045
tecpr1b
0.141
fbp1b
-0.044
cnga2a
0.136
pnp4b
-0.044
BX901923.1
0.133
apoa2
-0.043
AL954134.2
0.133
gatm
-0.043
BX901883.4
0.130
gnmt
-0.042
XLOC-033063
0.130
atp5l
-0.041
rasal3
0.130
zgc:123103
-0.041
CABZ01058222.1
0.126
apoc2
-0.041
KCNN2
0.126
rpl37
-0.040
LOC101884482
0.125
apoa4b.1
-0.040
LOC100329885
0.124
mat1a
-0.040
LOC100536981
0.124
hao1
-0.039
LOC110439920
0.120
eno3
-0.039
CU855854.1
0.116
ces2
-0.039
LOC100537404
0.114
fetub
-0.039
si:ch211-112c15.8
0.110
afp4
-0.038
si:dkey-240h12.4
0.109
cx32.3
-0.038
b4galnt1b
0.109
aldh7a1
-0.038
si:dkey-211i20.5
0.109
LOC110437731
-0.038
rock2bl
0.108
rbp4
-0.038
BX004972.1
0.105
suclg1
-0.038
BX510919.1
0.105
fgg
-0.038
LOC103910280
0.103
fgb
-0.038
mhc1zaa
0.098
vtnb
-0.037
crmp1
0.097
ttr
-0.037
igfn1.2
0.097
serpina1
-0.037
LOC110438511
0.096
grhprb
-0.037
stx11b.2
0.096
pklr
-0.036