Daniocell
si:ch211-255f4.9 (fin)
si:ch211-255f4.9
ZFIN
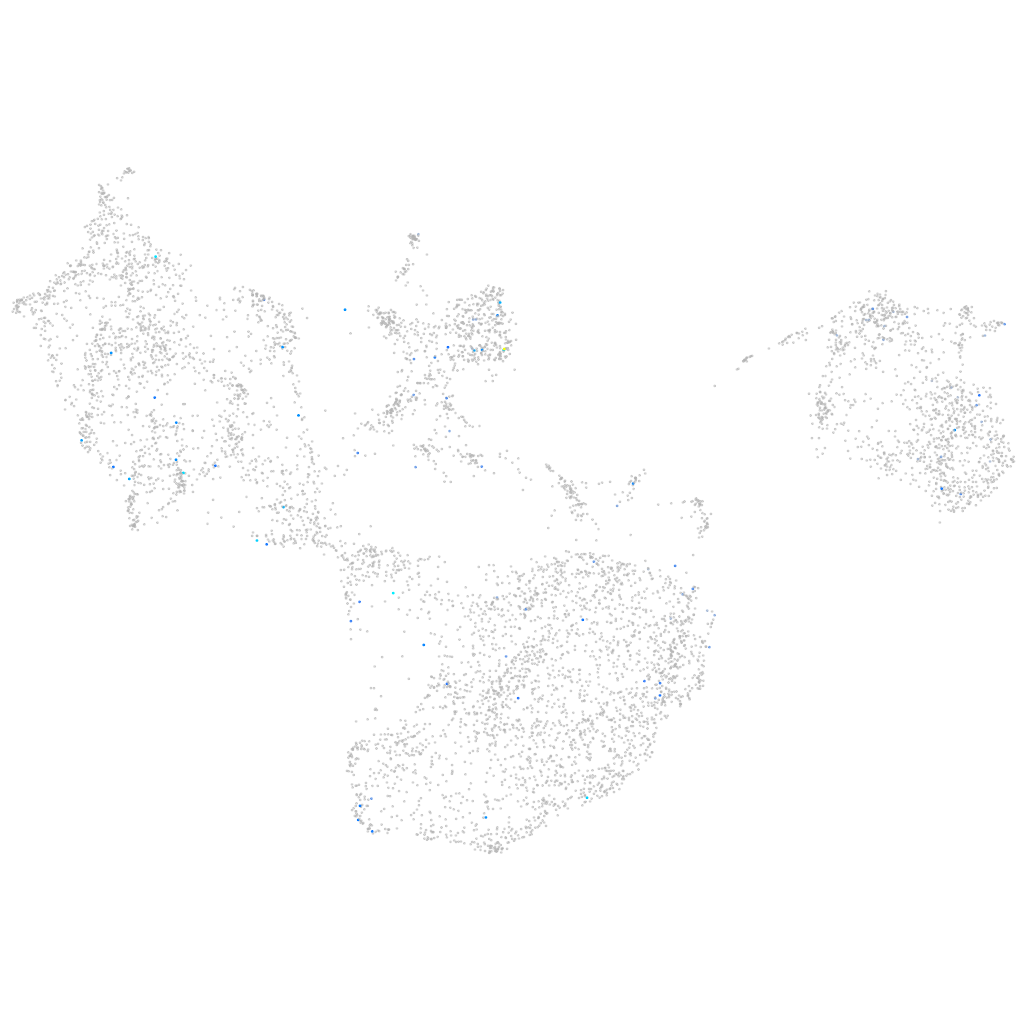
Gene expression UMAP
Display:
Expression
Stage
Other cell groups
all cells
blastomeres
PGCs
endoderm
axial mesoderm
muscle
mural cells /
non-skeletal muscle
mesenchyme
hematopoietic /
vasculature
pronephros
neural
spinal cord / glia
eye
taste / olfactory
otic / lateral line
epidermis
periderm
fin
ionocytes / mucous
pigment cells
Expression by stage/cluster
Correlated gene expression
Positive correlation
Negative correlation
Gene
r
Gene
r
XLOC-042292
0.265
actc1b
-0.031
si:ch211-212k18.6
0.250
pnp5a
-0.031
gpr101
0.197
tent4b
-0.029
si:dkey-3d18.5
0.193
pvalb2
-0.029
BX005368.1
0.182
cyt1
-0.028
si:dkey-20i20.10
0.180
krt4
-0.026
CU694380.2
0.170
cavin2a
-0.026
si:ch1073-153i20.2
0.170
capn2l
-0.026
LOC110438234
0.165
csrp1a
-0.025
CABZ01078767.1
0.164
zmp:0000001114
-0.025
LOC108190994
0.164
tmsb4x
-0.025
baiap2b
0.160
ak1
-0.024
BX936382.1
0.160
myof
-0.024
ankrd63
0.158
kitlgb
-0.024
CU062632.1
0.150
LOC100003133
-0.024
il1fma
0.139
pax9
-0.023
si:dkey-96l17.6
0.136
cyt1l
-0.023
LOC110439593
0.133
postnb
-0.023
LOC101882070
0.131
tmsb1
-0.023
XLOC-032903
0.129
cyfip1
-0.023
LOC100007824
0.128
vgll4b
-0.023
XLOC-034498
0.128
rsu1
-0.023
sstr3
0.125
zgc:162509
-0.023
XLOC-043772
0.125
bmp7b
-0.022
LOC108181471
0.125
rpz4
-0.022
si:zfos-1505d6.3
0.125
icn
-0.022
kcnq5b
0.124
hic2
-0.022
LOC101883783
0.123
pkp3a
-0.022
CABZ01099795.1
0.123
cldn1
-0.022
XLOC-014193
0.123
epgn
-0.022
dnajb5
0.122
fam129bb
-0.022
XLOC-013776
0.121
actn1
-0.022
noxred1
0.120
itgb3a
-0.022
PITPNC1
0.116
pvalb1
-0.022
flnca
0.114
si:dkey-248g15.3
-0.022