Daniocell
si:ch211-255f4.9 (hematopoietic / vasculature)
si:ch211-255f4.9
ZFIN
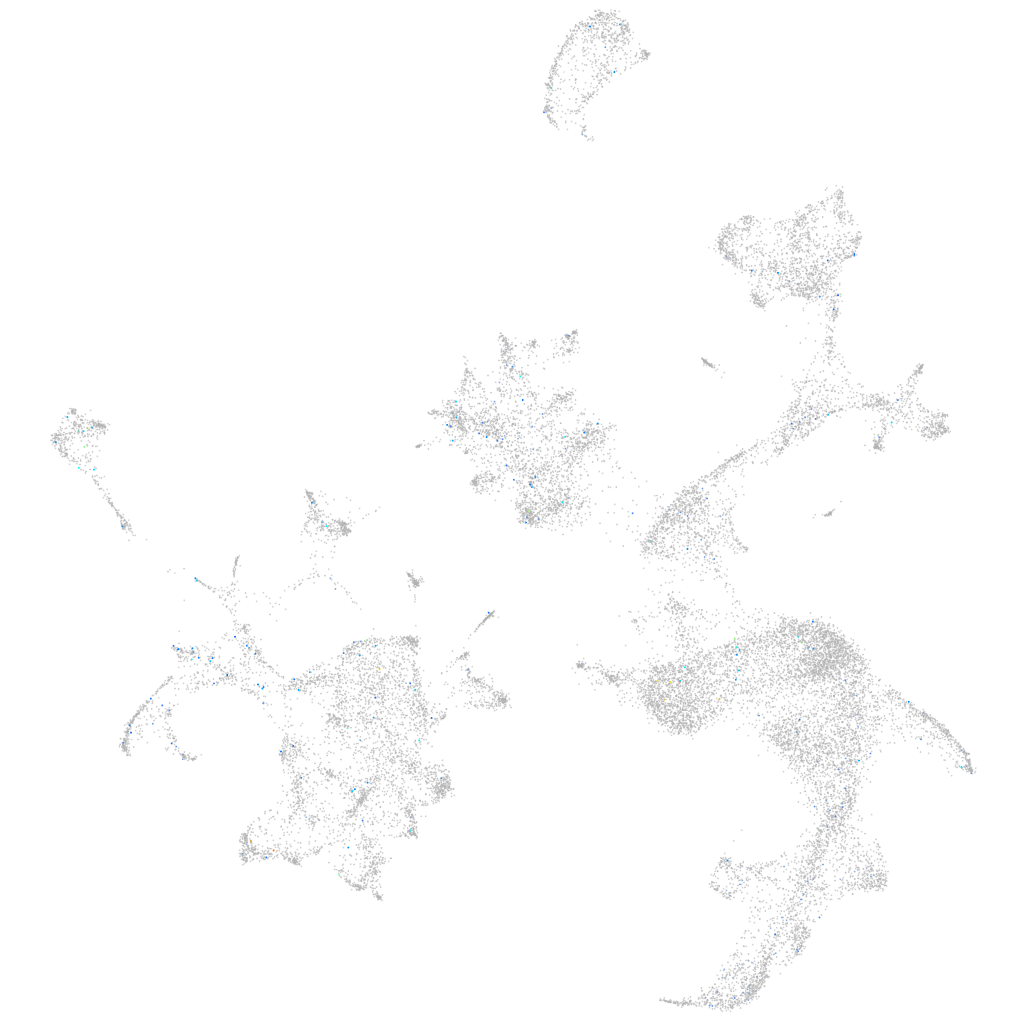
Gene expression UMAP
Display:
Expression
Stage
Other cell groups
all cells
blastomeres
PGCs
endoderm
axial mesoderm
muscle
mural cells /
non-skeletal muscle
mesenchyme
hematopoietic /
vasculature
pronephros
neural
spinal cord / glia
eye
taste / olfactory
otic / lateral line
epidermis
periderm
fin
ionocytes / mucous
pigment cells
Expression by stage/cluster
Correlated gene expression
Positive correlation
Negative correlation
Gene
r
Gene
r
XLOC-040517
0.153
pvalb1
-0.028
ndufa4l2b
0.108
actc1b
-0.026
BX001030.2
0.105
pvalb2
-0.022
LOC110439831
0.104
slc20a1a
-0.017
BX324202.1
0.100
krt4
-0.017
LOC103908953
0.098
hbbe1.3
-0.017
CR847898.1
0.098
hbbe1.2
-0.016
LOC101882470
0.094
ptpn6
-0.016
si:ch211-112b1.2
0.094
ckmb
-0.015
FO834825.1
0.094
icn2
-0.015
CT573408.1
0.091
hbae1.1
-0.014
si:dkeyp-6a3.1
0.088
cahz
-0.014
or106-5
0.088
myhz1.2
-0.014
XLOC-018968
0.086
tcnbb
-0.014
si:ch73-359m17.6
0.083
abi3a
-0.014
LOC110439953
0.078
laptm5
-0.014
tekt2
0.077
LOC100536213
-0.014
LOC100535133
0.076
slc4a1a
-0.014
XLOC-039841
0.072
tubb1
-0.014
si:dkey-30j22.1
0.071
dhrs7
-0.014
si:dkey-82i20.5
0.070
si:dkey-93h22.7
-0.014
CR855379.2
0.070
acta1b
-0.013
CR405715.1
0.069
XLOC-025423
-0.013
mir459
0.068
mylipa
-0.013
BX571712.1
0.067
tmod4
-0.013
si:dkey-61p9.7
0.065
coro1a
-0.013
ccr8.1
0.065
ing5a
-0.013
LOC101885209
0.064
tmsb1
-0.013
AL929192.1
0.063
hbae3
-0.013
si:dkey-241l7.6
0.063
tmem256
-0.013
sept4b
0.060
tnni2a.4
-0.013
cpeb1b
0.060
rgs5b
-0.013
LOC100331003
0.060
FERMT3 (1 of many)
-0.012
abcg2d
0.060
wasb
-0.012
lrrc14b
0.059
smyhc1
-0.012