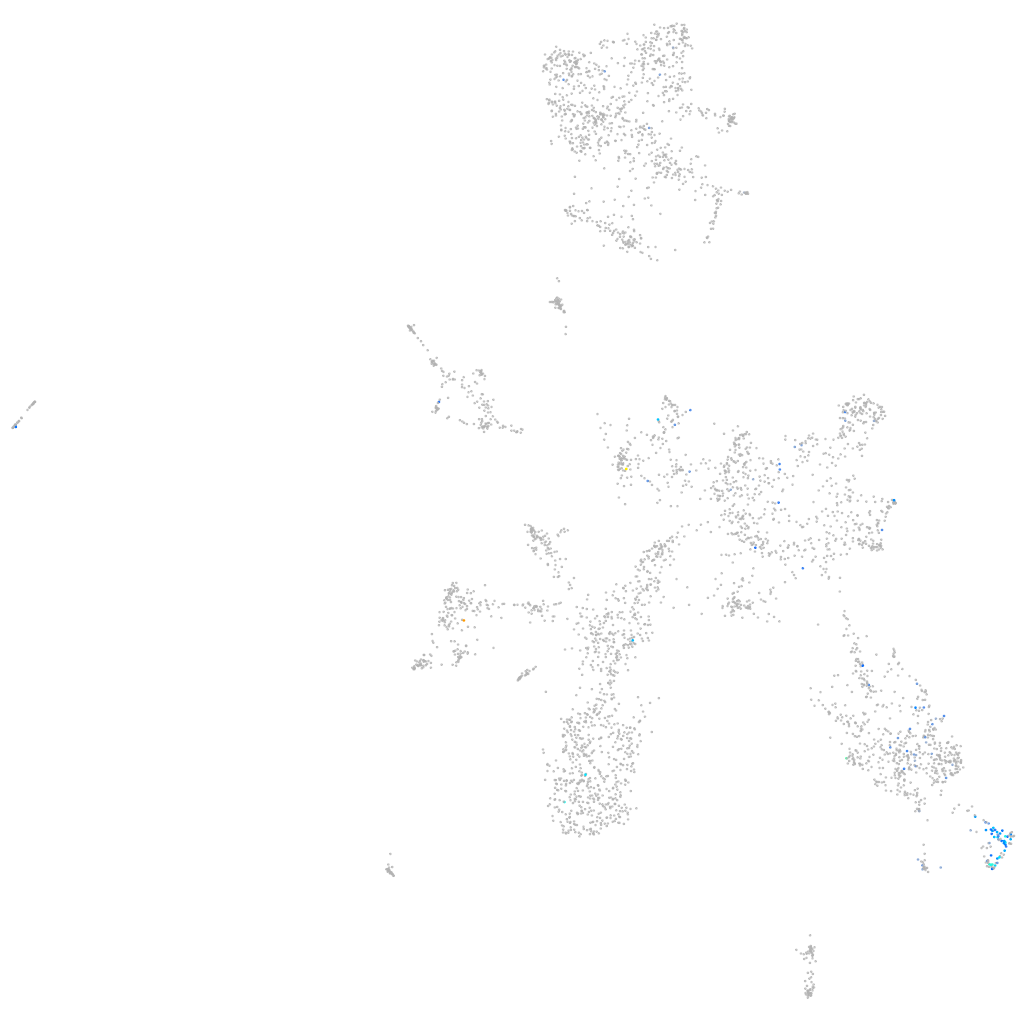
Daniocell
si:ch211-107e6.5 (taste / olfactory)
si:ch211-107e6.5
ZFIN
Gene expression UMAP
Display:
Expression
Stage
Other cell groups
all cells
blastomeres
PGCs
endoderm
axial mesoderm
muscle
mural cells /
non-skeletal muscle
mesenchyme
hematopoietic /
vasculature
pronephros
neural
spinal cord / glia
eye
taste / olfactory
otic / lateral line
epidermis
periderm
fin
ionocytes / mucous
pigment cells
Expression by stage/cluster
Correlated gene expression
Positive correlation
Negative correlation
Gene
r
Gene
r
si:ch211-163l21.7
0.448
marcksl1b
-0.087
c8h22orf15
0.446
ywhaz
-0.079
si:ch211-197n1.2
0.442
ptmab
-0.075
odf3b
0.438
marcksl1a
-0.073
zgc:112416
0.431
h3f3c
-0.071
si:dkeyp-69c1.9
0.422
hmgn2
-0.070
zgc:195356
0.420
jpt1b
-0.069
fut9d
0.420
hmgn6
-0.069
zmynd12
0.414
cirbpa
-0.068
si:dkey-88n24.12
0.414
hmgb3a
-0.068
tbata
0.411
h3f3d
-0.068
si:dkey-30e9.6
0.400
hmgn7
-0.064
si:dkey-76p14.2
0.396
nfasca
-0.064
ccdc169
0.394
agrn
-0.063
LOC100329490
0.393
prox1a
-0.060
stpg1
0.383
gng13a
-0.059
ttc29
0.381
ywhah
-0.058
gb:eh456644
0.376
ddx5
-0.057
ccdc153
0.375
zgc:92380
-0.057
zgc:158260
0.375
LOC100536671
-0.057
si:ch211-250c4.5
0.372
avil
-0.056
si:ch211-155m12.5
0.363
zc4h2
-0.055
si:ch211-186j3.3
0.360
anxa5b
-0.055
si:ch73-242m19.1
0.359
tubb5
-0.055
hsbp1l1
0.348
rgs1
-0.055
crocc2
0.339
CABZ01080702.1
-0.055
ttc25
0.338
hmgb1a
-0.054
si:ch211-203b8.6
0.328
vdac3
-0.054
si:dkey-11c5.11
0.323
pou2f3
-0.054
si:ch211-226m7.4
0.322
calm1a
-0.053
tex36
0.318
BX284638.1
-0.053
mustn1a
0.315
pvalb8
-0.052
cfap157
0.311
tox
-0.052
CR847897.1
0.311
myt1b
-0.052
paqr5b
0.309
si:dkeyp-72h1.1
-0.052