Daniocell
si:ch211-107e6.5 (endoderm)
si:ch211-107e6.5
ZFIN
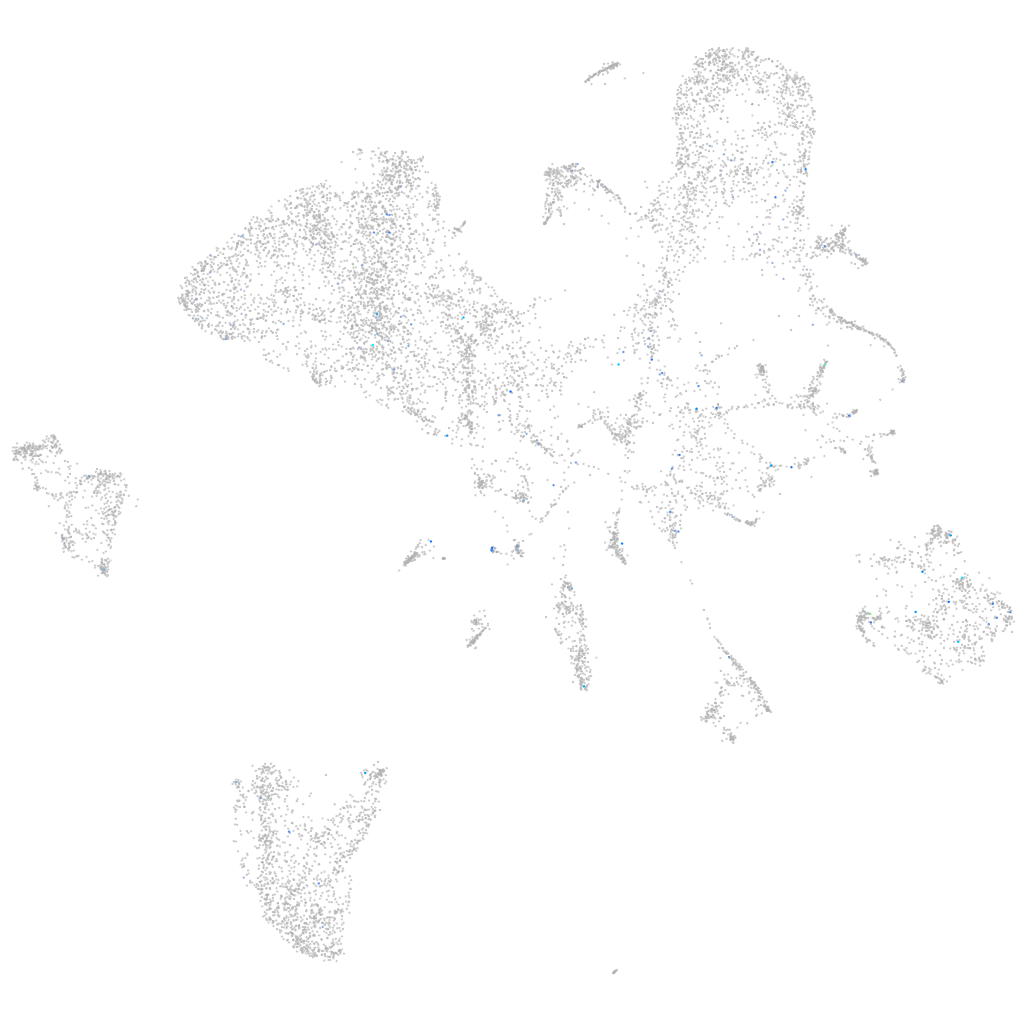
Gene expression UMAP
Display:
Expression
Stage
Other cell groups
all cells
blastomeres
PGCs
endoderm
axial mesoderm
muscle
mural cells /
non-skeletal muscle
mesenchyme
hematopoietic /
vasculature
pronephros
neural
spinal cord / glia
eye
taste / olfactory
otic / lateral line
epidermis
periderm
fin
ionocytes / mucous
pigment cells
Expression by stage/cluster
Correlated gene expression
Positive correlation
Negative correlation
Gene
r
Gene
r
CR385050.3
0.236
gatm
-0.037
CT573383.1
0.205
nupr1b
-0.036
BX649279.1
0.186
zgc:158463
-0.033
LOC101884122
0.180
pnp4b
-0.031
TULP1
0.175
gapdh
-0.031
CR925803.1
0.175
cgref1
-0.030
hormad1
0.158
IYD
-0.028
RF01190
0.155
gamt
-0.028
FO904901.1
0.153
ccl39.2
-0.027
XLOC-031005
0.152
sec24a
-0.027
LOC100333228
0.152
abat
-0.027
XLOC-013311
0.150
cyp2n13
-0.026
efhb
0.149
ahcy
-0.026
BX571954.1
0.140
rbp2a
-0.026
CR786576.1
0.140
acox1
-0.026
CU062487.1
0.140
pgk1
-0.026
LOC103910633
0.140
cx28.9
-0.026
LOC108180010
0.140
cyp4v8
-0.025
prl2
0.140
cyp3a65
-0.025
si:dkey-245f22.3
0.140
ctrl
-0.024
taar18d
0.140
si:dkeyp-4f2.1
-0.024
XLOC-041356
0.140
apoc2
-0.024
zgc:112965
0.140
abhd2a
-0.024
si:dkeyp-85h7.1
0.140
glud1b
-0.024
CT583626.1
0.140
hyou1
-0.024
si:ch211-223m11.2
0.139
apoa4b.1
-0.024
si:ch211-191j22.7
0.138
ckba
-0.024
si:dkey-23f9.9
0.138
prss59.1
-0.024
ebf3b
0.135
CT027638.1
-0.024
si:ch211-202h22.10
0.134
zgc:136461
-0.023
matk
0.133
oat
-0.023
LOC110440062
0.132
si:ch1073-464p5.5
-0.023
si:ch211-197f20.1
0.131
mat1a
-0.023
CU469104.1
0.129
ela2l
-0.023
piwil1
0.129
prss1
-0.023