Daniocell
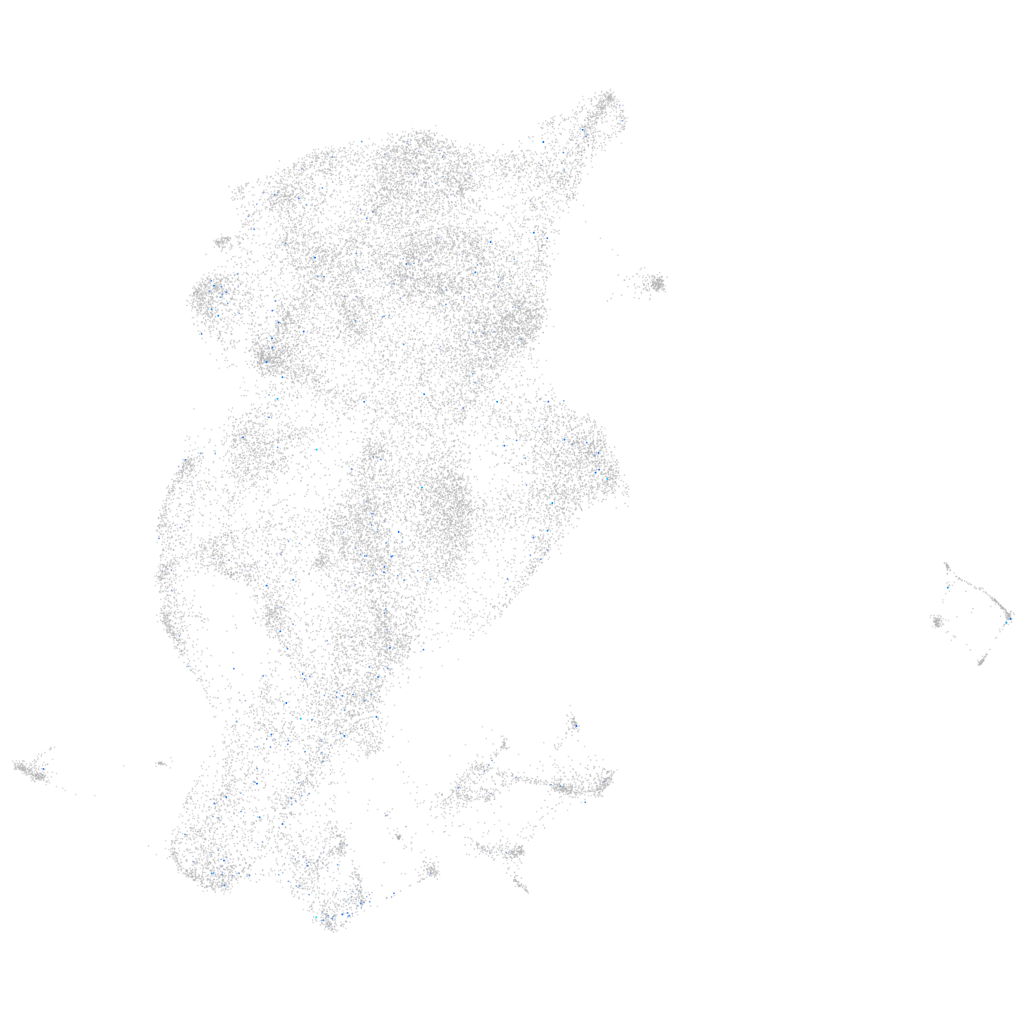
si:ch211-107e6.5 (periderm)
si:ch211-107e6.5
ZFIN
Gene expression UMAP
Display:
Expression
Stage
Other cell groups
all cells
blastomeres
PGCs
endoderm
axial mesoderm
muscle
mural cells /
non-skeletal muscle
mesenchyme
hematopoietic /
vasculature
pronephros
neural
spinal cord / glia
eye
taste / olfactory
otic / lateral line
epidermis
periderm
fin
ionocytes / mucous
pigment cells
Expression by stage/cluster
Correlated gene expression
Positive correlation
Negative correlation
Gene
r
Gene
r
LOC110439943
0.125
rplp2
-0.045
si:ch211-1o7.2
0.108
tcnbb
-0.042
LOC103909401
0.094
zgc:158463
-0.035
BX004785.1
0.092
si:dkey-202l22.6
-0.031
spp2
0.084
krtt1c19e
-0.029
XLOC-044290
0.076
pvalb1
-0.028
uox
0.075
icn2
-0.027
CT573383.1
0.075
wu:fa03e10
-0.027
LOC103909978
0.070
rps29
-0.026
kcnj14
0.067
si:dkeyp-51b9.3
-0.026
BX470259.1
0.067
si:dkey-151g10.6
-0.025
mustn1a
0.067
si:dkey-247k7.2
-0.025
LOC101885631
0.066
LOC110439372
-0.024
krt18a.1
0.066
COX3
-0.024
krt92
0.065
si:ch211-207n23.2
-0.024
XLOC-044226
0.063
rpl36
-0.023
cxcl11.1
0.063
fut9d
-0.023
si:dkey-286h21.1
0.062
arhgef4
-0.023
XLOC-004567
0.061
rpl6
-0.023
si:ch1073-155h21.1
0.060
CABZ01079276.1
-0.022
si:ch211-232p21.6
0.059
pvalb2
-0.022
XLOC-018389
0.059
rpl37
-0.022
si:ch211-279g13.1
0.058
ponzr3
-0.022
si:dkey-250k15.10
0.058
rplp1
-0.022
sult6b1
0.057
mt-co2
-0.021
ponzr5
0.056
rhbg
-0.021
znf972
0.056
slx1b
-0.021
dnase1l4.1
0.056
sesn1
-0.020
si:ch211-244e12.7
0.055
CR788316.1
-0.020
esrrgb
0.055
si:dkey-7c18.24
-0.020
ftr81
0.055
eevs
-0.020
XLOC-039754
0.054
traf3ip2l
-0.020
XLOC-009919
0.054
apoa2
-0.019
anxa1b
0.053
rpl38
-0.019
LOC100537816
0.053
rhcga
-0.019