Daniocell
si:ch211-107e6.5 (eye)
si:ch211-107e6.5
ZFIN
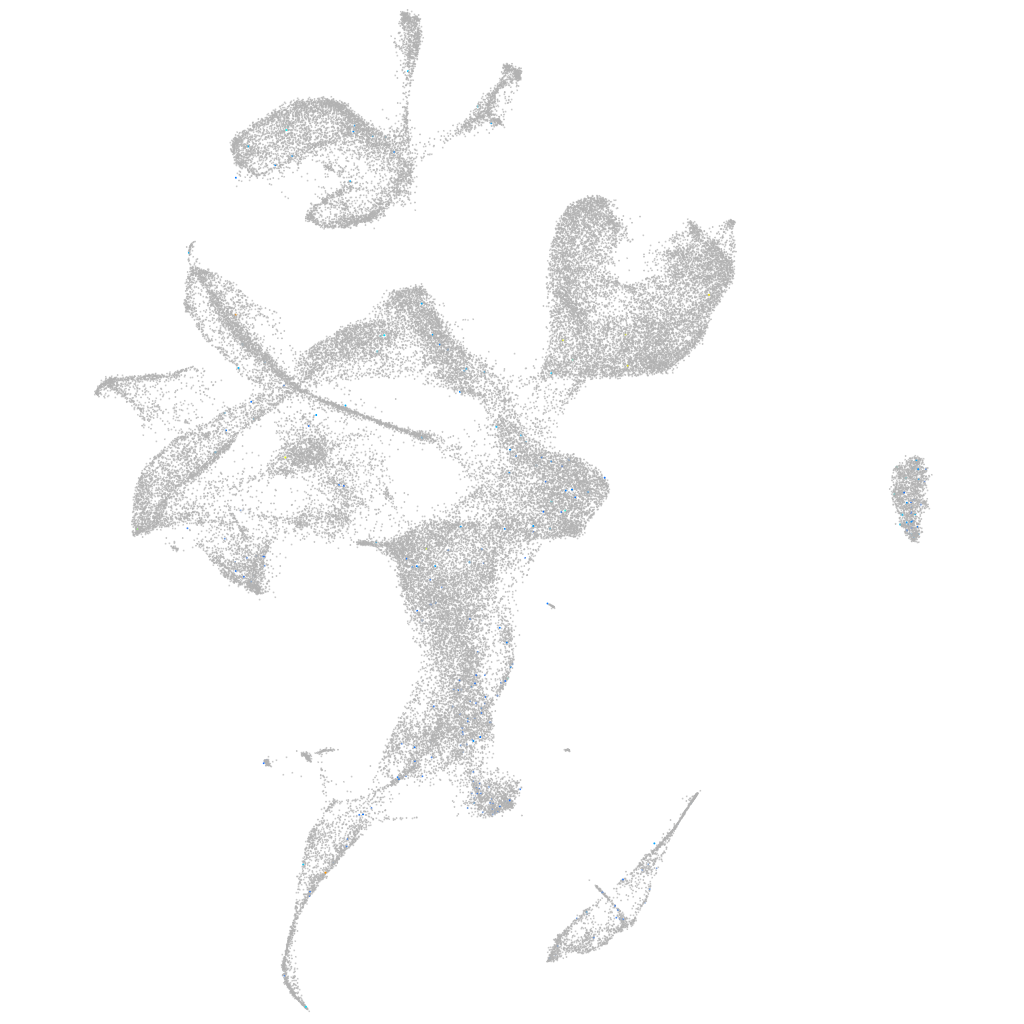
Gene expression UMAP
Display:
Expression
Stage
Other cell groups
all cells
blastomeres
PGCs
endoderm
axial mesoderm
muscle
mural cells /
non-skeletal muscle
mesenchyme
hematopoietic /
vasculature
pronephros
neural
spinal cord / glia
eye
taste / olfactory
otic / lateral line
epidermis
periderm
fin
ionocytes / mucous
pigment cells
Expression by stage/cluster
Correlated gene expression
Positive correlation
Negative correlation
Gene
r
Gene
r
si:dkey-28d5.13
0.133
atp6v0cb
-0.028
si:dkey-250k10.1
0.080
ckbb
-0.027
LOC110438960
0.074
syt5b
-0.026
si:dkey-285e18.2
0.074
ptmaa
-0.026
BX321875.1
0.072
rnasekb
-0.025
LO017843.1
0.070
h3f3c
-0.024
nitr11a
0.070
atp1a3a
-0.024
si:dkey-199k11.6
0.069
snap25b
-0.023
LOC103910193
0.068
cadm3
-0.022
LOC110438437
0.066
mt-atp6
-0.022
CU013526.1
0.065
CR383676.1
-0.020
FQ311879.1
0.065
epb41a
-0.020
acot9.2
0.064
si:ch1073-429i10.3.1
-0.020
CU468002.1
0.062
vamp1
-0.020
si:rp71-45g20.11
0.060
crx
-0.019
her11
0.059
mpp6b
-0.019
LOC100330283
0.056
COX3
-0.019
CU469568.1
0.055
gnao1b
-0.019
BX664742.3
0.055
calb2b
-0.019
CU207217.1
0.054
rs1a
-0.019
irf3
0.053
mt-co2
-0.019
CR396583.1
0.052
atp6v1e1b
-0.019
si:dkey-261j11.3
0.050
sypb
-0.019
nceh1a
0.050
pvalb1
-0.018
CABZ01088308.1
0.049
neurod1
-0.018
LOC108181461
0.049
foxg1b
-0.018
si:dkey-88l16.3
0.049
gapdhs
-0.018
si:ch211-173m16.2
0.048
si:ch1073-83n3.2
-0.018
CU639436.1
0.048
nrn1lb
-0.018
si:ch1073-80i24.3
0.048
stx3a
-0.017
LOC101884821
0.048
atp1b2a
-0.017
si:dkey-145c18.3
0.047
ndrg4
-0.017
hspb1
0.046
gnb3a
-0.017
XLOC-022888
0.045
atpv0e2
-0.017
p2ry6
0.045
rtn1a
-0.017