Daniocell
si:ch211-107e6.5 (mesenchyme)
si:ch211-107e6.5
ZFIN
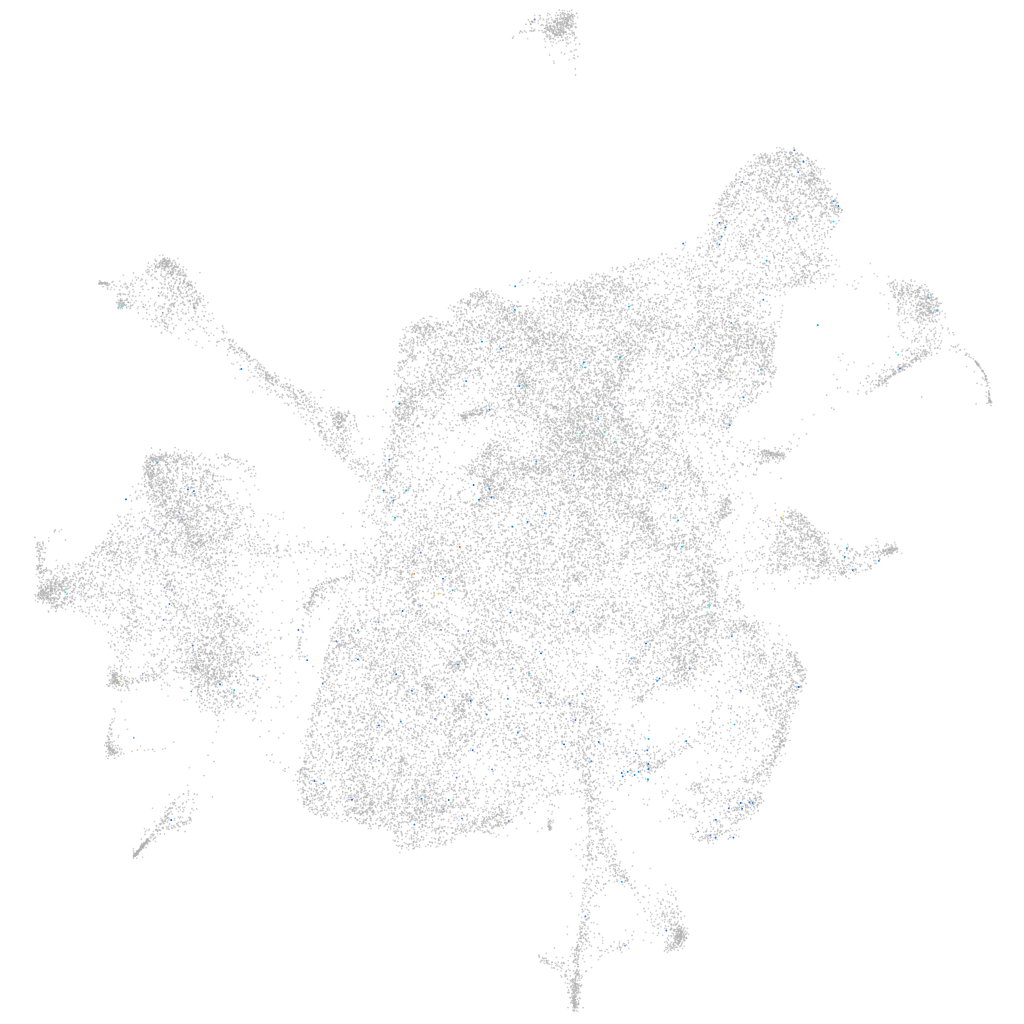
Gene expression UMAP
Display:
Expression
Stage
Other cell groups
all cells
blastomeres
PGCs
endoderm
axial mesoderm
muscle
mural cells /
non-skeletal muscle
mesenchyme
hematopoietic /
vasculature
pronephros
neural
spinal cord / glia
eye
taste / olfactory
otic / lateral line
epidermis
periderm
fin
ionocytes / mucous
pigment cells
Expression by stage/cluster
Correlated gene expression
Positive correlation
Negative correlation
Gene
r
Gene
r
CR450749.3
0.134
actc1b
-0.016
CABZ01074994.1
0.083
sfrp2
-0.016
noto
0.075
COX3
-0.016
FP102888.2
0.073
ptmaa
-0.016
si:dkey-98f17.5
0.066
zgc:158463
-0.015
LOC108180351
0.064
elavl3
-0.015
BX465205.1
0.063
cux1a
-0.015
XLOC-015433
0.060
CR383676.1
-0.014
si:dkey-4c15.8
0.056
wu:fc21g02
-0.014
BX000463.2
0.055
mylpfa
-0.014
ankef1b
0.053
nectin1b
-0.013
si:dkey-199f5.4
0.053
pvalb1
-0.013
si:dkey-11o15.10
0.053
gadd45ab
-0.013
FP016142.5
0.052
smad3a
-0.012
BX323450.1
0.052
bicc1b
-0.012
nfkb1
0.051
ckbb
-0.012
BX510929.1
0.049
col12a1a
-0.012
LOC108190704
0.048
myhz2
-0.012
si:zfos-411a11.2
0.048
tnnt3b
-0.012
si:ch73-184c24.1
0.046
cdh11
-0.012
traj35
0.045
quo
-0.012
GDPGP1
0.045
epha4a
-0.012
LOC110439879
0.045
ccl25b
-0.011
si:dkey-207b20.2
0.044
sh3pxd2aa
-0.011
XLOC-023372
0.043
hbbe1.1
-0.011
capsla
0.043
emc2
-0.011
XLOC-042792
0.043
ptprga
-0.011
CABZ01044235.1
0.043
lxn
-0.011
znf1150
0.042
myhz1.1
-0.011
LOC103909395
0.042
fabp10a
-0.011
LOC110438837
0.041
gchfr
-0.011
CU657976.1
0.040
nova2
-0.011
CR589947.2
0.040
KIF2A
-0.011
si:dkey-78k11.4
0.038
c1qtnf6a
-0.011
LOC110437829
0.038
deptor
-0.011