Daniocell
si:ch211-107e6.5 (muscle)
si:ch211-107e6.5
ZFIN
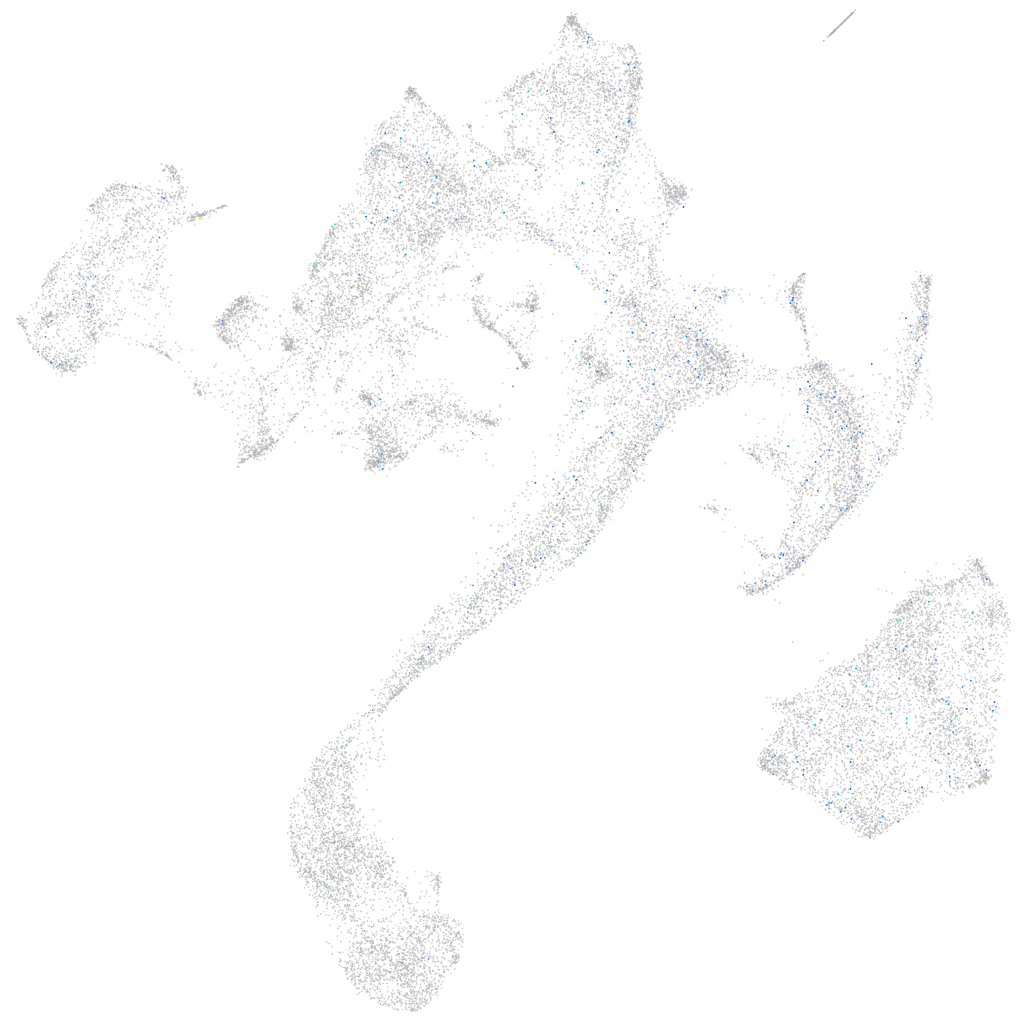
Gene expression UMAP
Display:
Expression
Stage
Other cell groups
all cells
blastomeres
PGCs
endoderm
axial mesoderm
muscle
mural cells /
non-skeletal muscle
mesenchyme
hematopoietic /
vasculature
pronephros
neural
spinal cord / glia
eye
taste / olfactory
otic / lateral line
epidermis
periderm
fin
ionocytes / mucous
pigment cells
Expression by stage/cluster
Correlated gene expression
Positive correlation
Negative correlation
Gene
r
Gene
r
cxcr5
0.070
tnnt3b
-0.038
LOC100149007
0.070
ckma
-0.036
AL929023.1
0.069
tnni2a.4
-0.034
LOC101886928
0.067
mylz3
-0.034
XLOC-018342
0.067
si:ch73-367p23.2
-0.034
LOC110439835
0.067
pvalb2
-0.034
LOC110437715
0.066
ckmb
-0.034
klhl10b.1
0.065
pvalb1
-0.033
BX004785.1
0.061
mylpfa
-0.033
XLOC-043106
0.060
myom2a
-0.033
CR932360.1
0.059
mylpfb
-0.032
zgc:174180
0.058
tnnt3a
-0.032
LOC110439812
0.057
myoz1b
-0.031
RYR2
0.056
atp2a1
-0.031
panx2
0.056
slc25a4
-0.031
si:ch211-87j1.4
0.054
CABZ01061524.1
-0.030
BX957279.1
0.054
prx
-0.030
LOC103911388
0.053
casq1a
-0.030
BX545856.1
0.053
actn3a
-0.030
FP245526.1
0.052
atp2a1l
-0.030
CT030005.2
0.052
nme2b.2
-0.029
XLOC-023549
0.049
hrc
-0.029
or128-6
0.049
jph1b
-0.029
XLOC-007664
0.049
si:dkey-211f22.5
-0.029
BX571940.1
0.049
hhatla
-0.029
si:ch73-335d12.2
0.048
ttn.1
-0.029
kcns3b
0.048
actc1b
-0.029
thbd
0.047
myom1a
-0.029
LOC110440222
0.047
myl1
-0.029
si:ch211-33e4.3
0.047
ak1
-0.029
svopa
0.045
ldb3b
-0.029
XLOC-043665
0.045
si:ch211-255p10.3
-0.028
LOC103909268
0.045
eef2l2
-0.028
igsf5b
0.045
si:dkey-16p21.8
-0.028
nitr6b
0.044
XLOC-001975
-0.028