Daniocell
si:ch211-107e6.5 (mural cells / non-skeletal muscle)
si:ch211-107e6.5
ZFIN
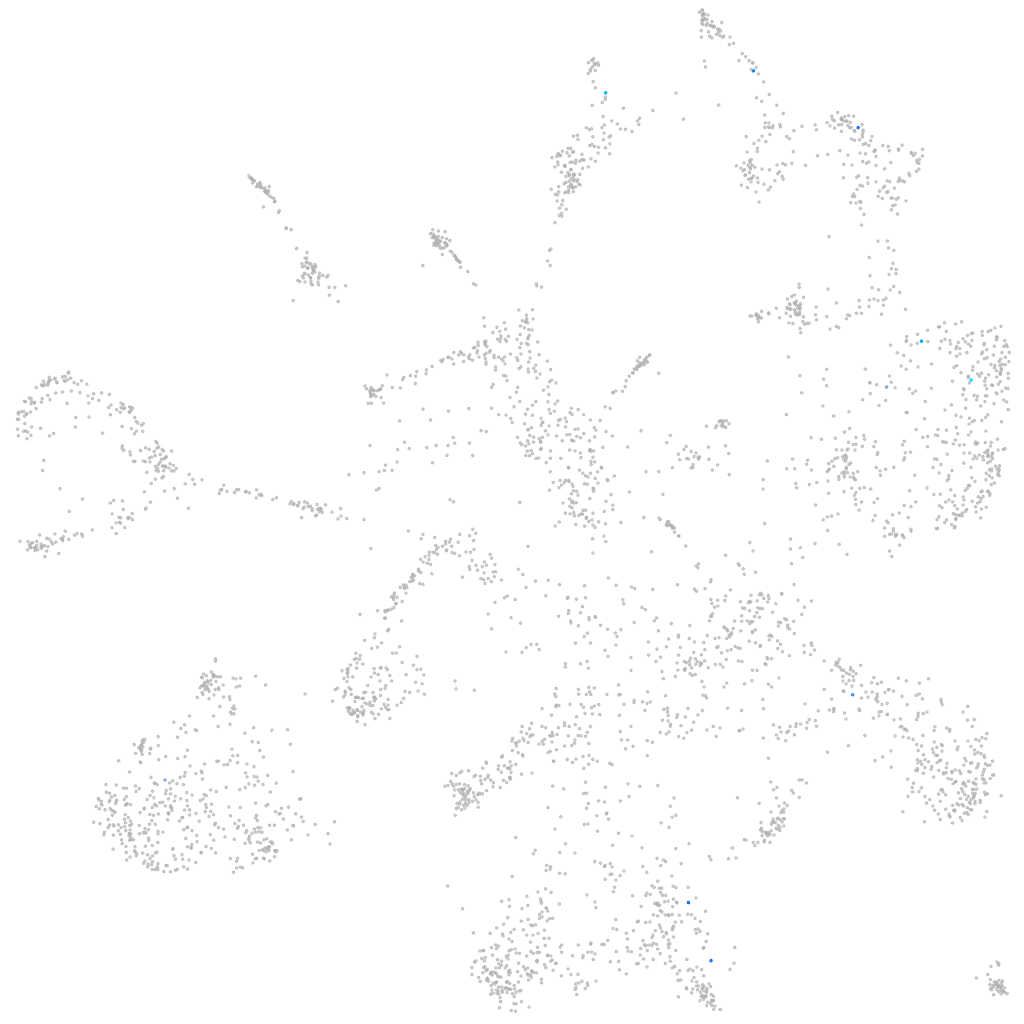
Gene expression UMAP
Display:
Expression
Stage
Other cell groups
all cells
blastomeres
PGCs
endoderm
axial mesoderm
muscle
mural cells /
non-skeletal muscle
mesenchyme
hematopoietic /
vasculature
pronephros
neural
spinal cord / glia
eye
taste / olfactory
otic / lateral line
epidermis
periderm
fin
ionocytes / mucous
pigment cells
Expression by stage/cluster
Correlated gene expression
Positive correlation
Negative correlation
Gene
r
Gene
r
LOC101885930
0.423
cyt1
-0.033
ggt1l2.1
0.415
si:ch1073-291c23.2
-0.029
LOC110437880
0.364
zgc:158463
-0.028
LOC108190050
0.327
rbpms2a
-0.028
LOC110437938
0.311
ier5l
-0.028
XLOC-043489
0.308
igfbp7
-0.028
tyrobp
0.295
mylz3
-0.027
si:ch211-112g6.4
0.237
NDUFB1
-0.027
dnai2a
0.236
cyp2ad3
-0.026
CR352226.1
0.236
XLOC-025423
-0.026
foxg1c
0.214
fgfr2
-0.025
vtnb
0.202
rdh10a
-0.025
si:dkey-9i23.6
0.189
col6a3
-0.025
XLOC-013219
0.162
mmp2
-0.024
LOC100538118
0.159
pbx1a
-0.024
cart4
0.158
arpc4l
-0.024
csrp3
0.151
fhl2a
-0.023
stab1
0.150
mt-co2
-0.023
h6pd
0.148
apoa2
-0.023
CABZ01018269.1
0.148
pim1
-0.023
si:dkey-5i3.5
0.147
cd248a
-0.023
CR628365.1
0.141
mt-co1
-0.022
LOC110438269
0.138
pkig
-0.022
FO834814.1
0.138
kdm1a
-0.021
BX927404.1
0.136
notch3
-0.021
drd3
0.134
dpm2
-0.021
esyt3
0.134
BX088707.3
-0.021
prkra
0.132
MED9
-0.021
LOC100334666
0.130
tmpoa
-0.021
crlf1b
0.127
lama4
-0.021
CABZ01035356.1
0.127
zfp36l1a
-0.021
LO017848.1
0.127
cox4i2
-0.021
nr6a1a
0.124
osr1
-0.021
mbip
0.122
prdx5
-0.021
XLOC-028354
0.121
ifitm1
-0.021