Daniocell
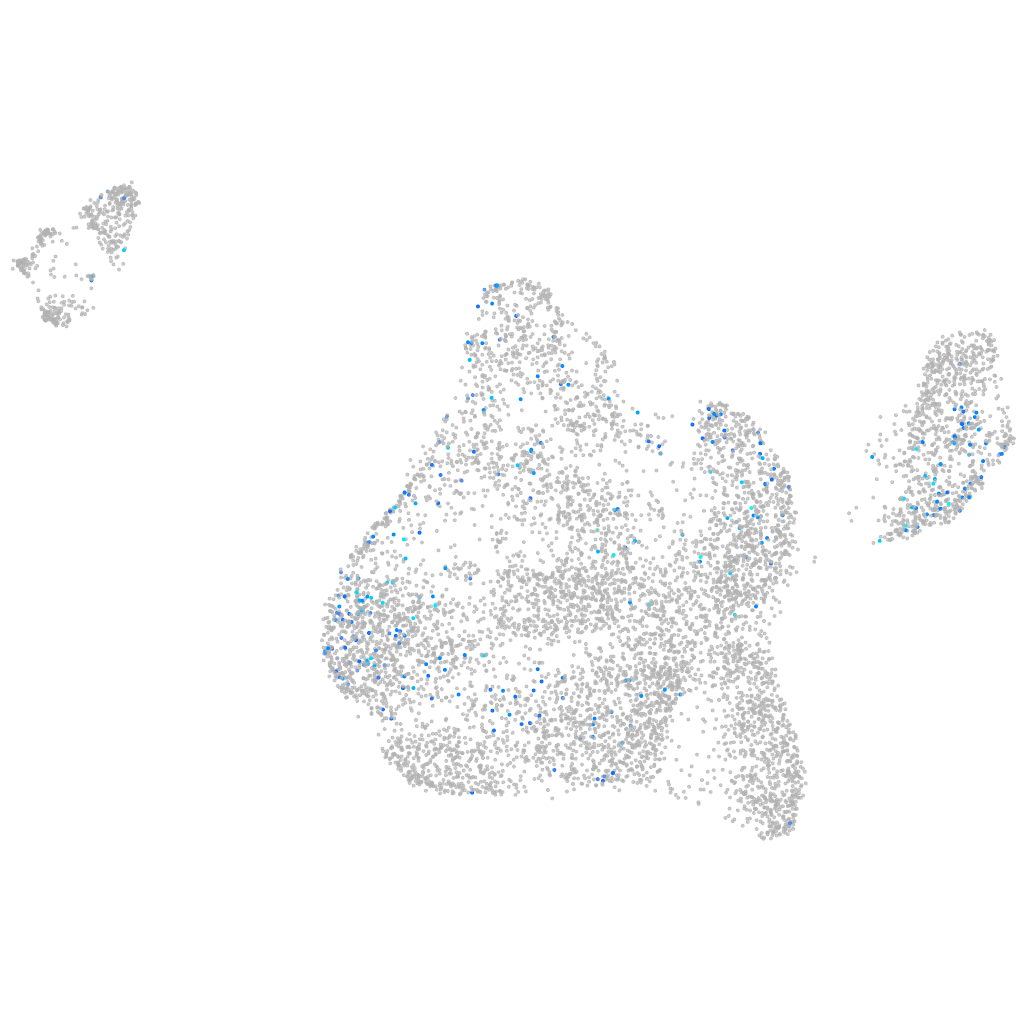
si:ch211-107e6.5 (blastomeres)
si:ch211-107e6.5
ZFIN
Gene expression UMAP
Display:
Expression
Stage
Other cell groups
all cells
blastomeres
PGCs
endoderm
axial mesoderm
muscle
mural cells /
non-skeletal muscle
mesenchyme
hematopoietic /
vasculature
pronephros
neural
spinal cord / glia
eye
taste / olfactory
otic / lateral line
epidermis
periderm
fin
ionocytes / mucous
pigment cells
Expression by stage/cluster
Correlated gene expression
Positive correlation
Negative correlation
Gene
r
Gene
r
si:dkey-27p18.5
0.107
zgc:110425
-0.060
hrh1
0.106
NC-002333.4
-0.053
mir203b
0.098
zgc:110216
-0.050
LOC101885134
0.096
si:dkey-108k21.10
-0.049
si:dkey-1m11.6
0.095
brd4
-0.047
BX005005.1
0.094
hsp90aa1.2
-0.046
LOC100004944
0.089
si:dkey-108k21.14
-0.045
hbae3
0.084
tpm2
-0.043
camk2n2
0.084
btg4
-0.043
gabrr2a
0.083
si:ch211-113a14.18
-0.042
BX537291.1
0.078
ell
-0.041
adgrb2
0.078
XLOC-044281
-0.040
CR848665.1
0.078
cmpk
-0.040
f7i
0.078
si:dkeyp-68b7.7
-0.037
LOC108179280
0.077
cat
-0.036
si:dkey-17e16.15
0.077
chordc1a
-0.036
mymk
0.076
si:dkey-261m9.12
-0.036
BX511067.1
0.075
zgc:153405
-0.036
CABZ01086127.1
0.075
CABZ01079276.1
-0.036
LOC100535588
0.075
rsrc1
-0.035
si:dkey-9i23.6
0.075
ppp2r2aa
-0.035
tmprss13a
0.074
casp2
-0.035
si:dkey-88n24.11
0.074
dis3l2
-0.035
FP236644.1
0.074
si:dkeyp-118h3.6
-0.035
LOC100330380
0.073
cenpf
-0.034
CABZ01060492.1
0.072
rif1
-0.034
si:ch211-59p23.1
0.072
CABZ01113954.1
-0.034
si:ch211-276k2.1
0.072
ccdc82
-0.034
LOC797799
0.071
alg3
-0.034
CR848791.1
0.071
crebbpa
-0.033
LOC100007229
0.069
wasla
-0.033
rpl12
0.068
dnajc2
-0.033
cyp21a2
0.068
ncl
-0.033
LOC108192084
0.068
si:ch211-199g17.2
-0.033
hnrnpabb
0.068
rpp25l
-0.033