Daniocell
scel (muscle)
sciellin
ZFIN
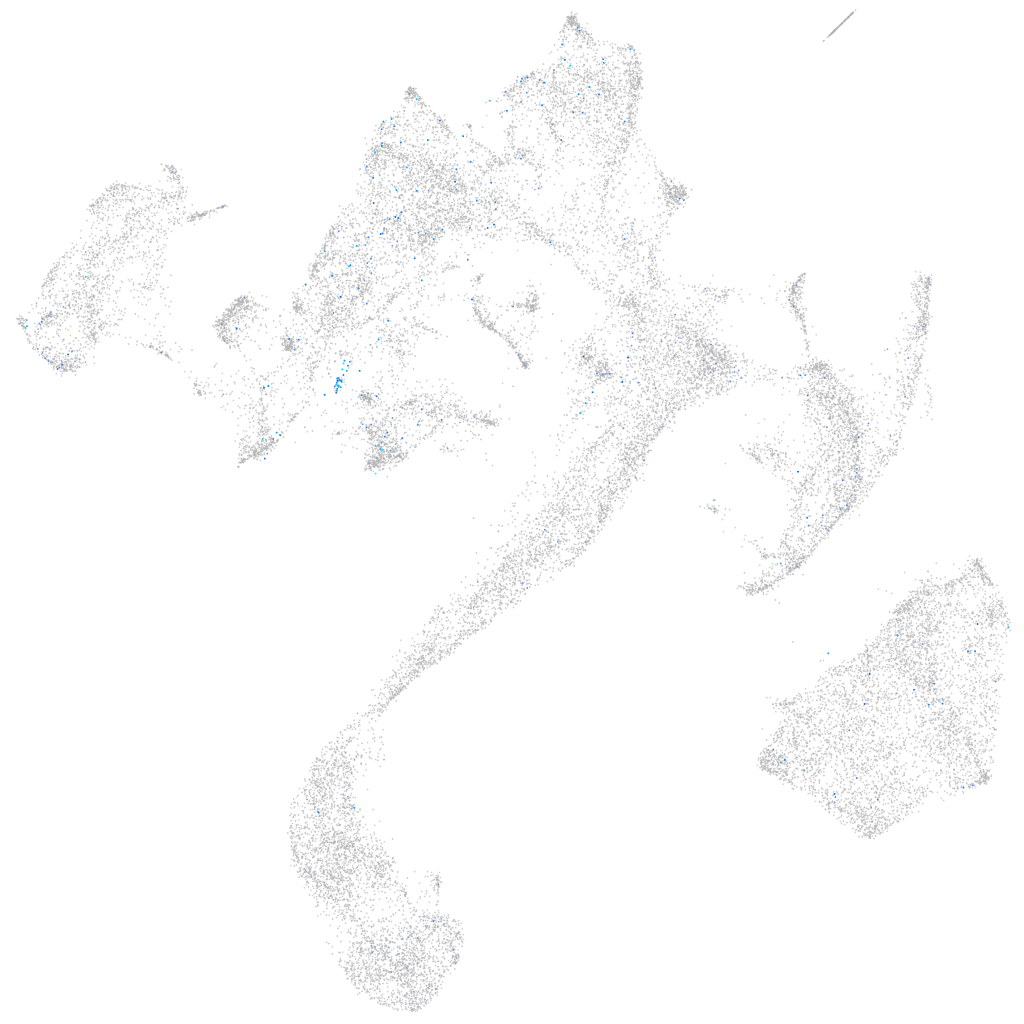
Gene expression UMAP
Display:
Expression
Stage
Other cell groups
all cells
blastomeres
PGCs
endoderm
axial mesoderm
muscle
mural cells /
non-skeletal muscle
mesenchyme
hematopoietic /
vasculature
pronephros
neural
spinal cord / glia
eye
taste / olfactory
otic / lateral line
epidermis
periderm
fin
ionocytes / mucous
pigment cells
Expression by stage/cluster
Correlated gene expression
Positive correlation
Negative correlation
Gene
r
Gene
r
si:ch211-207n23.2
0.238
serbp1a
-0.051
si:dkey-248g15.3
0.202
hmga1a
-0.045
si:dkey-222n6.2
0.186
snrpb
-0.041
si:ch211-195b11.3
0.184
NC-002333.4
-0.041
icn2
0.176
ncl
-0.041
krt17
0.176
hspb1
-0.041
agr1
0.165
dkc1
-0.040
XLOC-041945
0.156
npm1a
-0.039
zgc:193505
0.154
abcf1
-0.038
si:dkey-247k7.2
0.154
ddx39ab
-0.038
icn
0.150
hnrnpa0a
-0.038
tcnbb
0.150
snrpf
-0.038
si:ch211-157c3.4
0.147
nucks1a
-0.038
si:ch1073-340i21.3
0.145
eif2s2
-0.038
cyt1
0.143
eif4bb
-0.037
fut9d
0.141
eif5a2
-0.037
krt4
0.140
hdgfl2
-0.037
BX901957.1
0.136
hspd1
-0.036
stard14
0.136
ptges3b
-0.036
krtt1c19e
0.134
syncrip
-0.036
CU695073.1
0.133
erh
-0.036
CABZ01074298.1
0.132
rps12
-0.036
selenow2b
0.131
cnbpa
-0.036
tmsb1
0.131
srsf5a
-0.035
cldne
0.131
zgc:110425
-0.035
krt5
0.130
rpl5b
-0.035
wu:fb18f06
0.130
snrpd1
-0.035
wu:fa03e10
0.130
tma7
-0.035
s100w
0.130
nop56
-0.035
apodb
0.127
ppiaa
-0.034
si:dkey-7c18.24
0.127
ebna1bp2
-0.034
CR788316.1
0.126
acin1a
-0.034
cyt1l
0.125
si:dkey-102m7.3
-0.034
evplb
0.124
nop58
-0.034
XLOC-011066
0.124
rbm4.3
-0.034