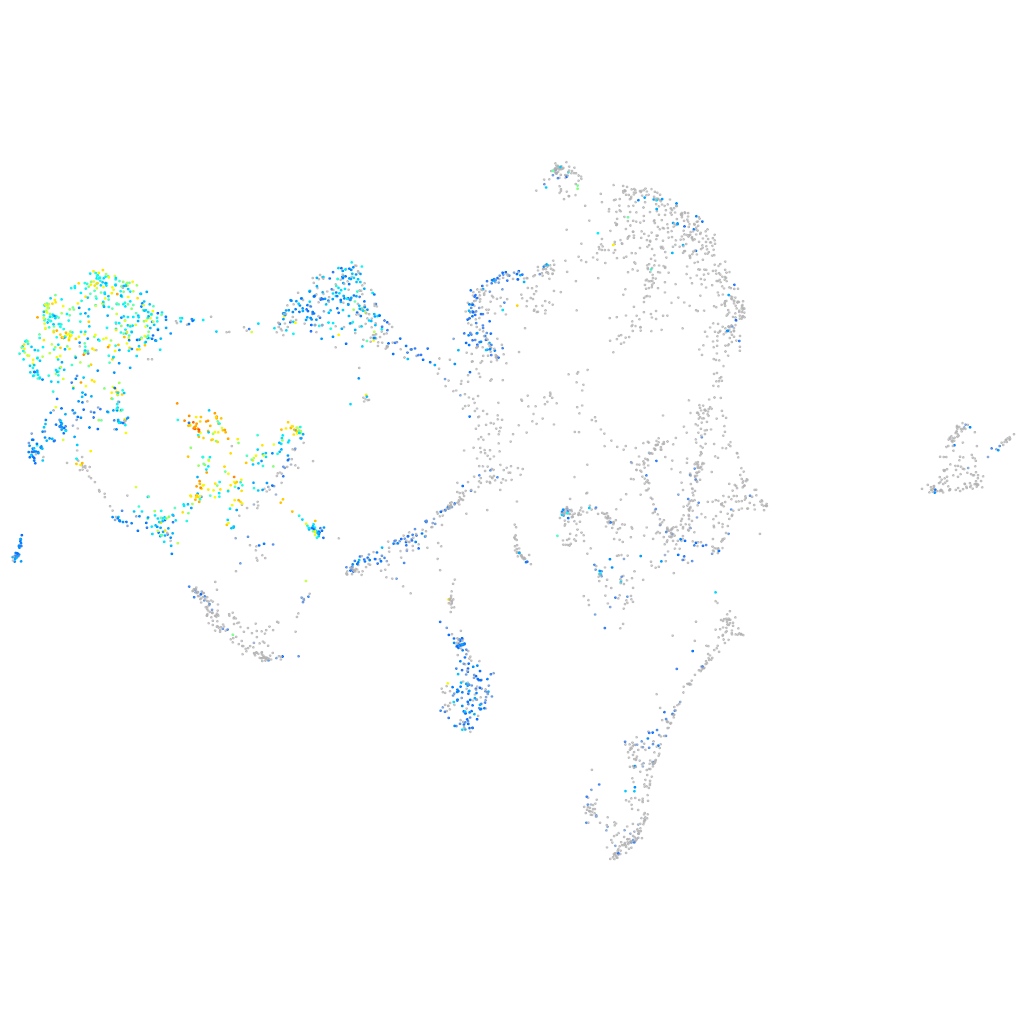
Daniocell
scel (ionocytes / mucous-producing)
sciellin
ZFIN
Gene expression UMAP
Display:
Expression
Stage
Other cell groups
all cells
blastomeres
PGCs
endoderm
axial mesoderm
muscle
mural cells /
non-skeletal muscle
mesenchyme
hematopoietic /
vasculature
pronephros
neural
spinal cord / glia
eye
taste / olfactory
otic / lateral line
epidermis
periderm
fin
ionocytes / mucous
pigment cells
Expression by stage/cluster
Correlated gene expression
Positive correlation
Negative correlation
Gene
r
Gene
r
zgc:111983
0.752
ptmab
-0.401
si:ch211-157c3.4
0.751
si:ch211-222l21.1
-0.361
si:ch211-125o16.4
0.729
ptmaa
-0.314
si:ch211-207n23.2
0.726
si:ch73-281n10.2
-0.306
stx11b.1
0.724
stmn1a
-0.295
si:dkeyp-51b9.3
0.710
hmgn3
-0.294
si:ch73-204p21.2
0.709
h3f3a
-0.287
si:ch73-52f15.5
0.704
h2afvb
-0.282
lye
0.694
hmga1a
-0.273
stard14
0.693
tubb2b
-0.268
anxa1c
0.692
hmgn2
-0.268
dhrs13a.2
0.686
marcksb
-0.264
si:ch211-217k17.9
0.661
zgc:92380
-0.263
ppl
0.658
si:ch211-288g17.3
-0.258
elovl7b
0.649
hmgb2b
-0.258
anxa1b
0.647
agr2
-0.253
apodb
0.643
spaca4l
-0.250
agr1
0.642
sub1a
-0.250
rhcga
0.635
tspan7
-0.248
si:ch211-195b11.3
0.634
hmgb1b
-0.248
abcb5
0.633
hmgb3a
-0.248
krt17
0.633
cx43.4
-0.245
si:dkey-222n6.2
0.623
capn8
-0.243
mgst1.2
0.620
si:ch211-39i22.1
-0.242
icn2
0.614
tmed4
-0.241
evplb
0.607
hnrnpaba
-0.237
pnp5a
0.598
hmgn7
-0.236
zgc:193505
0.589
snrpe
-0.236
ponzr3
0.589
ilf2
-0.235
XLOC-011066
0.587
foxa3
-0.233
plekhf1
0.583
h3f3d
-0.232
wu:fa03e10
0.582
nucks1a
-0.230
CABZ01027551.1
0.579
slc39a7
-0.229
anxa1a
0.578
snrpg
-0.227
mid1ip1a
0.576
ssr3
-0.225