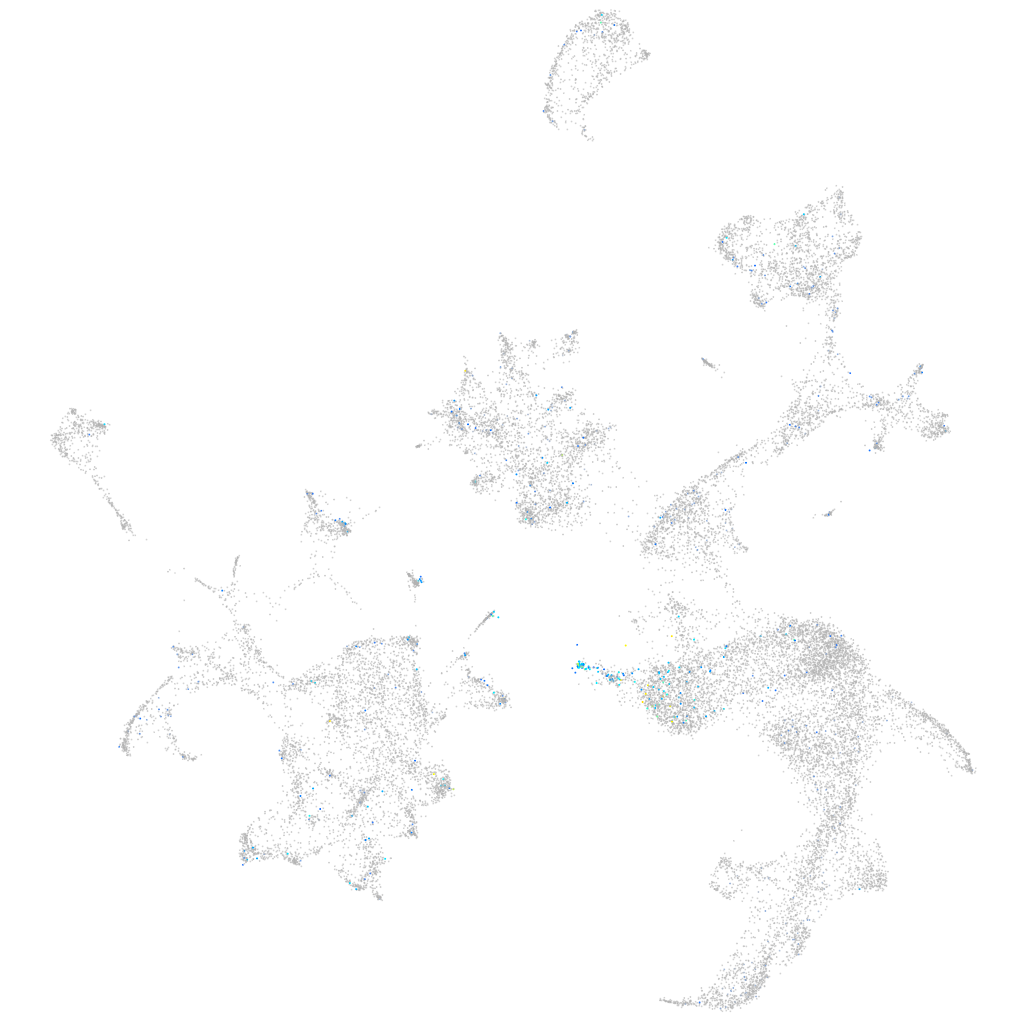
Daniocell
scel (hematopoietic / vasculature)
sciellin
ZFIN
Gene expression UMAP
Display:
Expression
Stage
Other cell groups
all cells
blastomeres
PGCs
endoderm
axial mesoderm
muscle
mural cells /
non-skeletal muscle
mesenchyme
hematopoietic /
vasculature
pronephros
neural
spinal cord / glia
eye
taste / olfactory
otic / lateral line
epidermis
periderm
fin
ionocytes / mucous
pigment cells
Expression by stage/cluster
Correlated gene expression
Positive correlation
Negative correlation
Gene
r
Gene
r
icn2
0.213
hbbe3
-0.035
si:ch211-207n23.2
0.200
zgc:153409
-0.028
si:ch211-195b11.3
0.199
abcf1
-0.028
si:dkey-222n6.2
0.195
rps12
-0.027
zgc:193505
0.191
pabpc1a
-0.026
cldne
0.189
eif3s10
-0.026
wu:fb18f06
0.188
serbp1a
-0.025
anxa1c
0.178
hdgfl2
-0.025
krt4
0.176
hnrnpub
-0.025
s100w
0.176
eif4bb
-0.025
cyt1
0.175
ammecr1
-0.024
ppl
0.173
blvra
-0.024
si:ch211-157c3.4
0.173
rps18
-0.024
lye
0.171
fam50a
-0.023
anxa1b
0.170
urod
-0.023
si:ch211-125o16.4
0.170
alad
-0.023
elovl7b
0.167
si:ch211-222l21.1
-0.023
krt17
0.166
zgc:56699
-0.023
si:ch73-204p21.2
0.164
ddx18
-0.023
evplb
0.162
eif5b
-0.022
zgc:111983
0.160
hmbsb
-0.022
si:dkey-248g15.3
0.159
hnrnpa0a
-0.021
dhrs13a.2
0.157
ssb
-0.021
capn2l
0.157
hmbsa
-0.021
krt1-19d
0.154
CABZ01005379.1
-0.021
si:dkey-19b23.12
0.153
ppox
-0.021
si:dkey-87o1.2
0.152
blf
-0.021
cldnb
0.148
bcas2
-0.021
cyt1l
0.146
cbx5
-0.021
si:ch73-347e22.8
0.143
rps3
-0.020
cldn23a
0.142
seta
-0.020
krtt1c19e
0.142
zgc:163057
-0.020
krt97
0.142
srrm1
-0.020
si:dkey-221j11.3
0.141
prpf40a
-0.020
agr1
0.140
nucks1a
-0.020