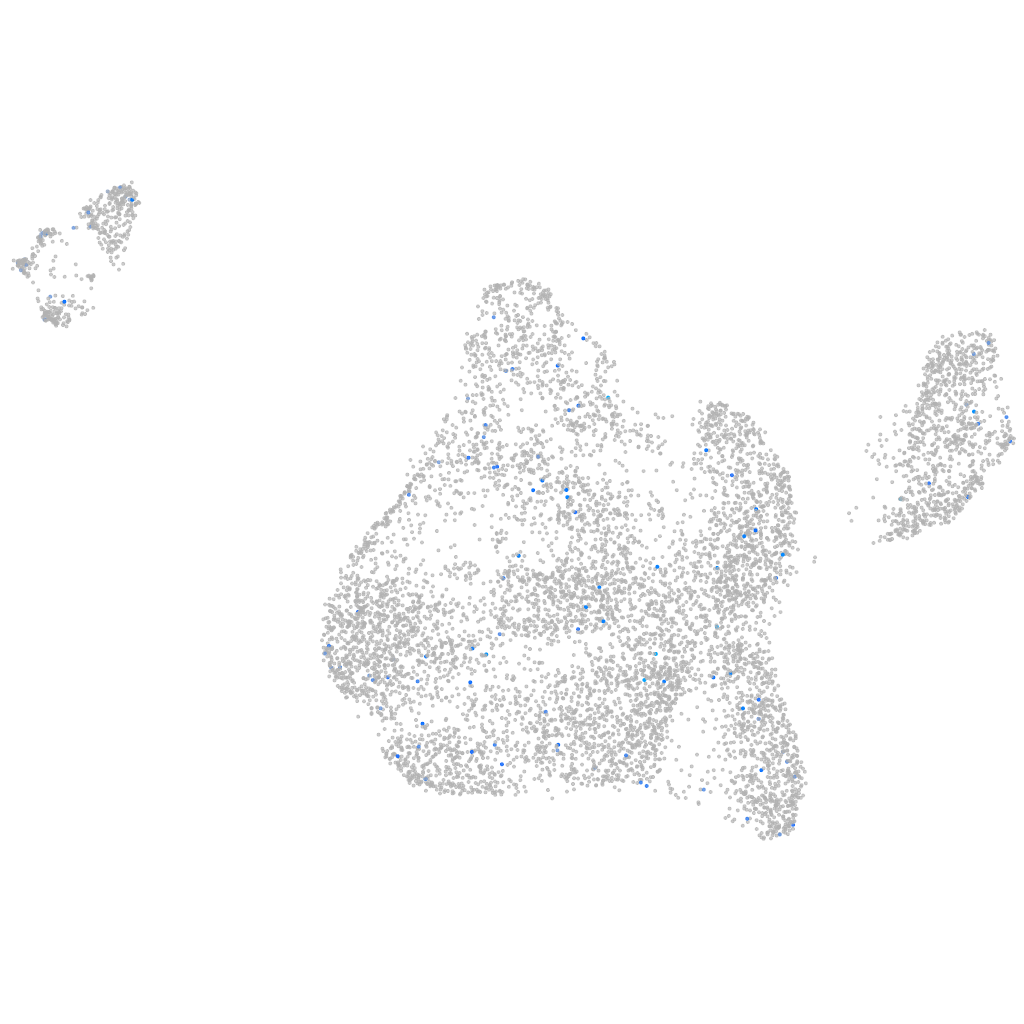
Daniocell
scel (blastomeres)
sciellin
ZFIN
Gene expression UMAP
Display:
Expression
Stage
Other cell groups
all cells
blastomeres
PGCs
endoderm
axial mesoderm
muscle
mural cells /
non-skeletal muscle
mesenchyme
hematopoietic /
vasculature
pronephros
neural
spinal cord / glia
eye
taste / olfactory
otic / lateral line
epidermis
periderm
fin
ionocytes / mucous
pigment cells
Expression by stage/cluster
Correlated gene expression
Positive correlation
Negative correlation
Gene
r
Gene
r
LOC569568
0.163
hif1al
-0.040
CABZ01087025.3
0.125
si:ch211-222l21.1
-0.035
zgc:195050
0.116
si:ch1073-80i24.3
-0.034
entpd8
0.115
eif2s2
-0.032
aknad1
0.110
LOC108179355
-0.031
npvf
0.107
rpl35
-0.030
FO818722.1
0.106
marcksl1b
-0.029
ppp1r1b
0.106
cxcl12a
-0.029
LOC101882559
0.106
BX957362.1
-0.029
gfap
0.105
rps16
-0.029
si:dkey-32n7.7
0.103
nxt2
-0.028
XLOC-004335
0.103
si:ch73-1a9.3
-0.028
aldh1a3
0.101
rrs1
-0.028
LOC103911920
0.101
noc4l
-0.028
LOC101882555
0.100
rps28
-0.028
sox6
0.097
ctnnbl1
-0.027
si:ch73-281f12.4
0.097
cx43.4
-0.027
LOC103912040
0.097
hnrnpa1b
-0.027
arsib
0.096
snrpd1
-0.026
FO904898.6
0.094
sox19a
-0.025
LOC103909736
0.094
tardbpl
-0.025
si:ch211-74m13.1
0.092
npm1a
-0.025
LOC101883516
0.089
clasp2
-0.025
dnase1l1l
0.089
MED9
-0.025
LOC101884915
0.088
XLOC-004189
-0.025
XLOC-022736
0.086
hspb1
-0.024
tnfrsf9a
0.086
znf346
-0.024
si:ch211-238e22.8
0.086
letm1
-0.024
si:dkey-78l4.6
0.086
ccdc12
-0.024
XLOC-007364
0.086
cirbpb
-0.024
LOC103909593
0.085
mplkip
-0.024
fabp1b.1
0.083
knop1
-0.024
CU466285.1
0.081
akap12b
-0.024
CR381579.4
0.080
stm
-0.024
si:ch211-195o20.7
0.080
thoc5
-0.024