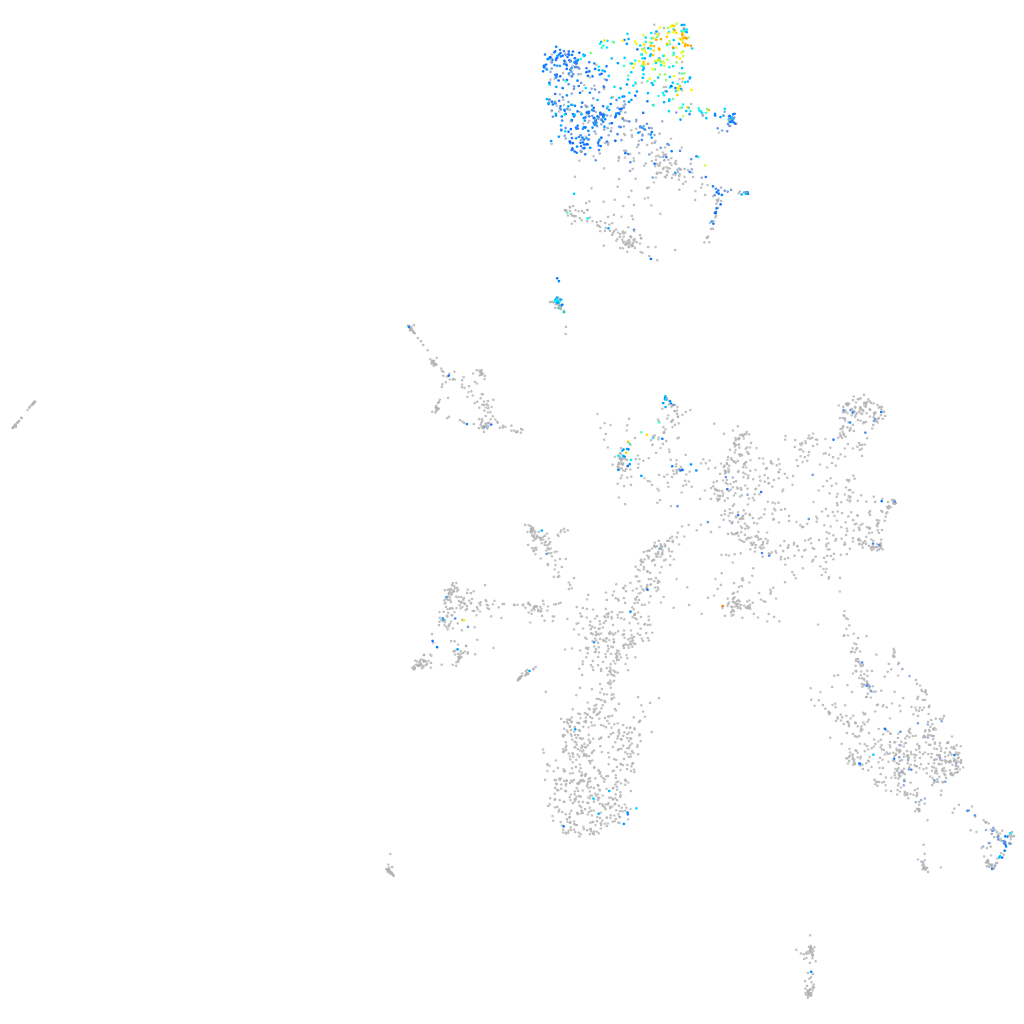
Daniocell
scel (taste / olfactory)
sciellin
ZFIN
Gene expression UMAP
Display:
Expression
Stage
Other cell groups
all cells
blastomeres
PGCs
endoderm
axial mesoderm
muscle
mural cells /
non-skeletal muscle
mesenchyme
hematopoietic /
vasculature
pronephros
neural
spinal cord / glia
eye
taste / olfactory
otic / lateral line
epidermis
periderm
fin
ionocytes / mucous
pigment cells
Expression by stage/cluster
Correlated gene expression
Positive correlation
Negative correlation
Gene
r
Gene
r
krt1-19d
0.776
elavl3
-0.340
evplb
0.743
tmsb
-0.314
ponzr5
0.731
NC-002333.4
-0.291
si:dkey-19b23.12
0.711
tspan2a
-0.288
ppl
0.702
pvalb5
-0.286
zgc:153665
0.659
stmn1b
-0.284
si:ch211-157c3.4
0.658
rtn1a
-0.273
icn2
0.635
tmeff1b
-0.271
si:cabz01007794.1
0.629
atf5a
-0.269
krt92
0.622
tuba1a
-0.268
CR926130.1
0.615
adcyap1b
-0.268
zgc:193505
0.609
si:dkey-276j7.1
-0.268
LOC100331080
0.589
insm1a
-0.266
si:ch73-199e17.1
0.587
LOC100537342
-0.262
foxq1a
0.581
zgc:65894
-0.256
LOC100536671
0.580
si:dkeyp-75h12.5
-0.255
si:ch73-347e22.8
0.576
scg2b
-0.253
stx11b.1
0.574
gng3
-0.250
agr1
0.569
si:ch211-153b23.5
-0.249
ociad2
0.561
sncb
-0.244
vill
0.554
chga
-0.240
si:ch211-217k17.9
0.551
zgc:55461
-0.239
gng13a
0.538
ebf3a
-0.237
zgc:165423
0.538
vdac3
-0.234
si:dkey-248g15.3
0.535
fstl5
-0.234
crip1
0.533
fabp10b
-0.230
gcnt4a
0.527
fthl31
-0.227
klf5a
0.524
si:ch211-10a23.2
-0.226
caspb
0.523
olfm1b
-0.225
si:dkey-87o1.2
0.523
abhd2b
-0.223
zgc:110333
0.519
bcl11ba
-0.222
si:ch73-204p21.2
0.519
nrsn1
-0.221
s100w
0.518
gnao1a
-0.221
ceacam1
0.516
uncx
-0.219
eppk1
0.515
capslb
-0.219