Daniocell
scel (axial mesoderm)
sciellin
ZFIN
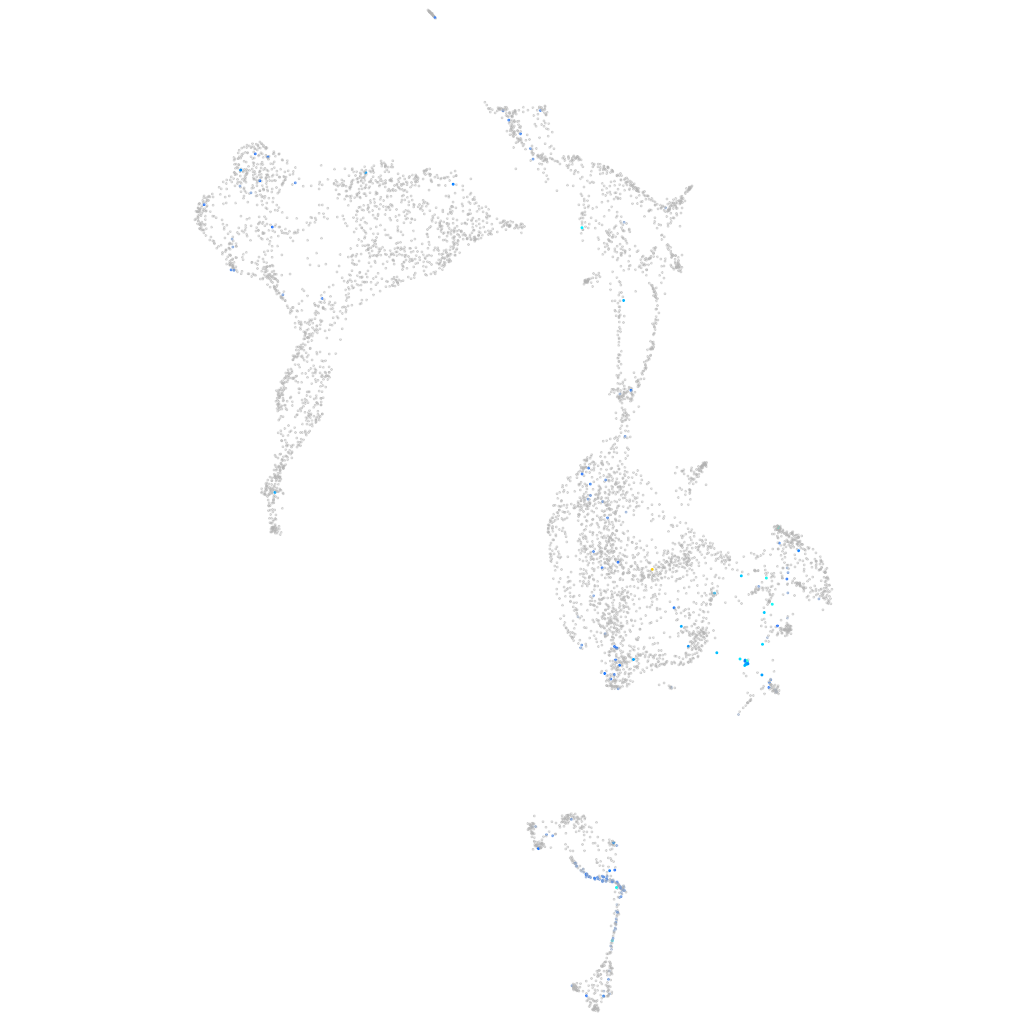
Gene expression UMAP
Display:
Expression
Stage
Other cell groups
all cells
blastomeres
PGCs
endoderm
axial mesoderm
muscle
mural cells /
non-skeletal muscle
mesenchyme
hematopoietic /
vasculature
pronephros
neural
spinal cord / glia
eye
taste / olfactory
otic / lateral line
epidermis
periderm
fin
ionocytes / mucous
pigment cells
Expression by stage/cluster
Correlated gene expression
Positive correlation
Negative correlation
Gene
r
Gene
r
swap70a
0.313
ptmab
-0.122
si:dkey-247k7.2
0.297
h2afvb
-0.105
evplb
0.286
msna
-0.104
BX901957.1
0.274
hnrnpaba
-0.103
icn2
0.259
si:ch73-281n10.2
-0.100
krt17
0.255
nucks1a
-0.096
krt1-19d
0.254
qkia
-0.096
si:dkey-193p11.2
0.244
asph
-0.096
LOC100149234
0.239
ube2v2
-0.095
si:ch211-207n23.2
0.236
hmgn7
-0.094
ANXA1 (1 of many)
0.232
hmga1a
-0.092
stx11b.1
0.229
hnrnpa0b
-0.092
cyt1
0.226
khdrbs1a
-0.092
krt4
0.224
hmgb2b
-0.092
si:ch73-347e22.8
0.224
si:ch73-1a9.3
-0.091
si:dkeyp-51b9.3
0.222
ncl
-0.088
anxa1c
0.221
hmgb2a
-0.088
s100w
0.220
cx43.4
-0.086
zgc:111983
0.217
hnrnpa0a
-0.086
ppl
0.215
seta
-0.086
si:dkey-7c18.24
0.211
rbm8a
-0.086
tcnbb
0.209
hspb1
-0.086
btr01
0.208
si:ch211-288g17.3
-0.084
rnf183
0.205
cirbpa
-0.084
si:dkey-87o1.2
0.202
ilf3b
-0.083
icn
0.202
acin1a
-0.083
adgrf6
0.199
ddx39ab
-0.083
zgc:112964
0.198
anp32a
-0.083
CU571315.2
0.198
p4ha2
-0.083
s100v1
0.194
hnrnpabb
-0.082
si:dkey-248g15.3
0.192
top1l
-0.082
ggt1a
0.192
serf2
-0.082
LOC110438742
0.190
snrnp70
-0.082
wu:fb18f06
0.188
marcksl1b
-0.082
zgc:193505
0.186
setb
-0.082