Daniocell
scel (pronephros)
sciellin
ZFIN
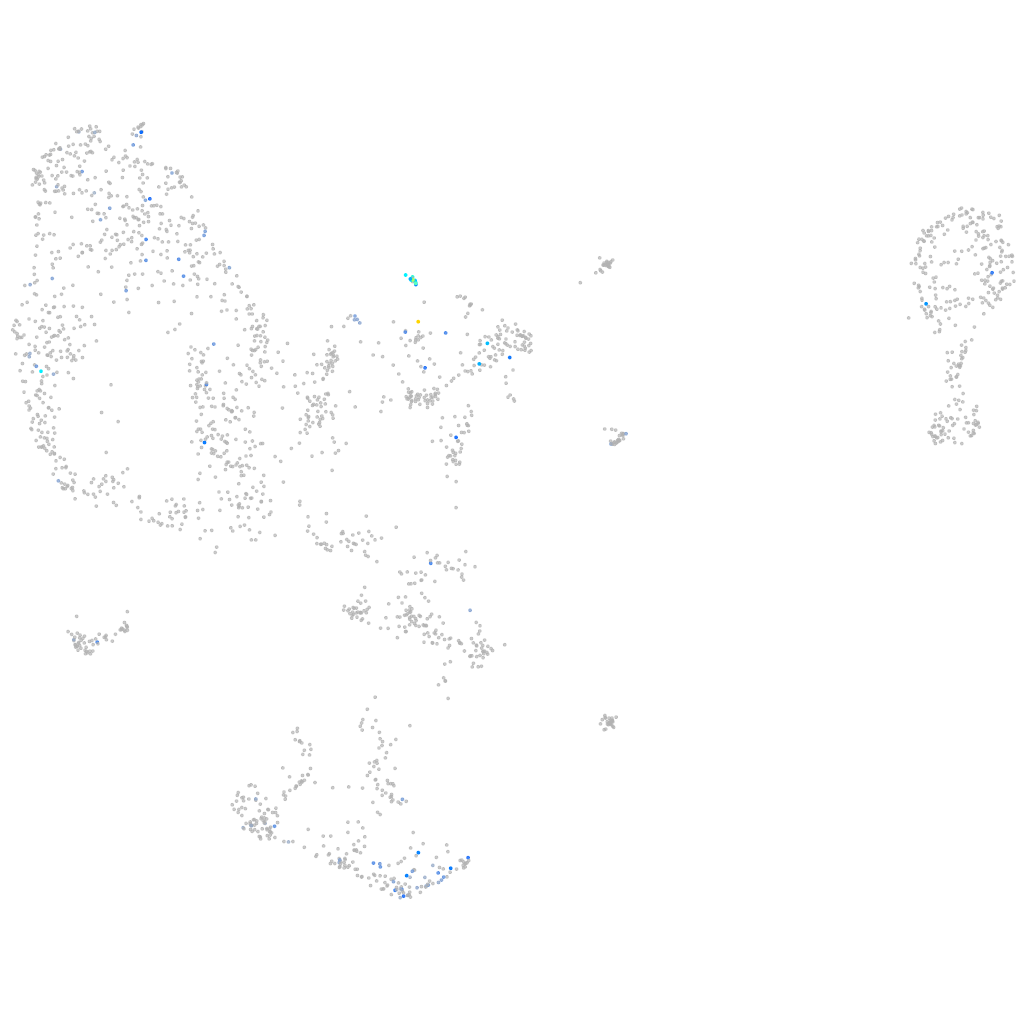
Gene expression UMAP
Display:
Expression
Stage
Other cell groups
all cells
blastomeres
PGCs
endoderm
axial mesoderm
muscle
mural cells /
non-skeletal muscle
mesenchyme
hematopoietic /
vasculature
pronephros
neural
spinal cord / glia
eye
taste / olfactory
otic / lateral line
epidermis
periderm
fin
ionocytes / mucous
pigment cells
Expression by stage/cluster
Correlated gene expression
Positive correlation
Negative correlation
Gene
r
Gene
r
zgc:113442
0.565
si:ch211-222l21.1
-0.111
fam129aa
0.565
ptmab
-0.106
si:ch73-52f15.5
0.528
si:ch73-281n10.2
-0.085
CABZ01027551.1
0.520
NC-002333.4
-0.081
abcb5
0.518
hmga1a
-0.072
znf750
0.503
cfl1
-0.071
arid6
0.499
zgc:86598
-0.070
si:ch211-125o16.4
0.479
hnrnpa1a
-0.068
dhrs13a.2
0.468
XLOC-042222
-0.068
LOC100149234
0.461
hspb1
-0.066
AL929237.1
0.448
hmgn7
-0.066
si:ch211-105c13.3
0.437
foxj1a
-0.065
si:ch211-157c3.4
0.418
srrm2
-0.065
mir725
0.417
luc7l3
-0.065
abca12
0.415
hmgn6
-0.064
fut9d
0.412
si:dkey-165e24.1
-0.064
elovl7b
0.408
si:rp71-17i16.6
-0.063
LOC100331080
0.407
h2afvb
-0.062
CR388148.2
0.396
sf3b2
-0.060
si:ch211-195b11.3
0.396
si:ch73-1a9.3
-0.059
cmah
0.395
apex1
-0.059
lye
0.395
LOC101883320
-0.059
LOC101886933
0.392
wu:fb97g03
-0.059
evpla
0.387
erh
-0.058
krt17
0.386
rps12
-0.058
LOC100535170
0.386
khdrbs1a
-0.058
si:ch211-217k17.9
0.384
meaf6
-0.058
hsd17b12a
0.384
BX927258.1
-0.058
BX901957.1
0.382
mki67
-0.058
zgc:111983
0.381
hmgb1b
-0.057
si:dkeyp-87d8.8
0.370
top1l
-0.057
btr02
0.369
enkur
-0.057
FO834828.1
0.366
zgc:55461
-0.057
si:ch211-139n6.3
0.366
capsla
-0.057
wu:fa03e10
0.361
taf9
-0.057