Daniocell
scel (otic / lateral line)
sciellin
ZFIN
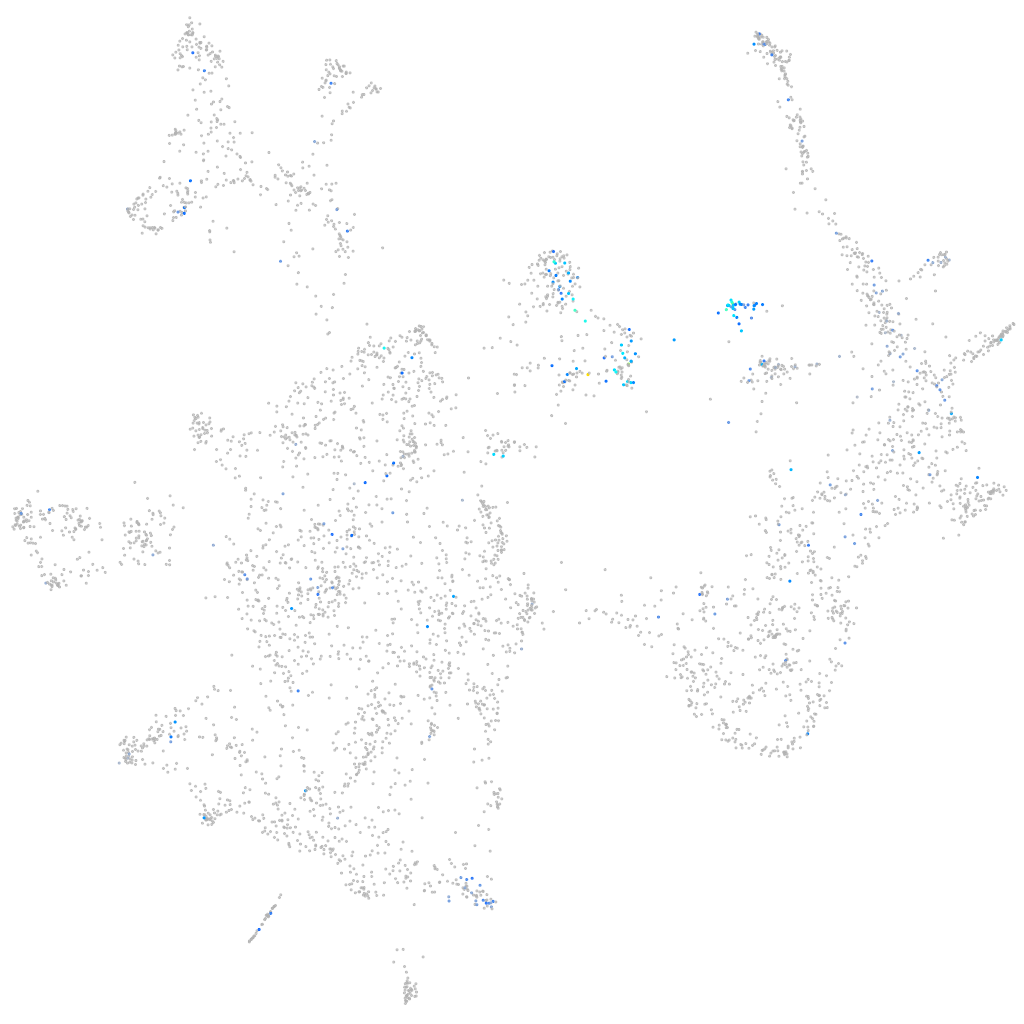
Gene expression UMAP
Display:
Expression
Stage
Other cell groups
all cells
blastomeres
PGCs
endoderm
axial mesoderm
muscle
mural cells /
non-skeletal muscle
mesenchyme
hematopoietic /
vasculature
pronephros
neural
spinal cord / glia
eye
taste / olfactory
otic / lateral line
epidermis
periderm
fin
ionocytes / mucous
pigment cells
Expression by stage/cluster
Correlated gene expression
Positive correlation
Negative correlation
Gene
r
Gene
r
si:ch211-207n23.2
0.453
six1b
-0.111
zgc:111983
0.428
si:ch211-152c2.3
-0.103
icn2
0.423
eya1
-0.099
si:ch211-157c3.4
0.416
stm
-0.084
si:ch73-204p21.2
0.402
six1a
-0.082
si:ch73-52f15.5
0.402
hsp90ab1
-0.081
si:dkey-222n6.2
0.395
sox10
-0.079
krt17
0.390
otomp
-0.077
agr1
0.386
ptges3b
-0.073
si:dkey-248g15.3
0.380
bricd5
-0.073
wu:fa03e10
0.374
serbp1a
-0.073
anxa1c
0.369
si:ch211-222l21.1
-0.072
si:dkeyp-51b9.3
0.361
id1
-0.071
si:dkey-187j14.4
0.355
cldna
-0.071
si:ch211-125o16.4
0.352
tuba8l3
-0.071
zgc:123217
0.343
eif5a2
-0.071
anxa1b
0.339
nme3
-0.067
si:ch211-217k17.9
0.337
sfrp1a
-0.066
zgc:100868
0.335
zgc:153409
-0.065
stx11b.1
0.330
srsf5a
-0.065
ppl
0.314
ammecr1
-0.065
cldn23a
0.307
si:dkey-98f17.3
-0.065
si:ch73-329n5.1
0.306
snrpb
-0.065
ponzr2
0.305
ptbp1b
-0.065
zgc:153932
0.302
h3f3d
-0.065
zgc:193505
0.302
foxp4
-0.063
XLOC-011066
0.299
abcf1
-0.063
krt1-19d
0.294
si:dkey-42i9.4
-0.063
si:dkey-221j11.3
0.293
cdca7b
-0.063
grhl1
0.291
rpl5b
-0.062
si:dkey-247k7.2
0.285
agr2
-0.062
anxa1a
0.284
rps18
-0.062
tlcd1
0.281
si:dkey-16l2.17
-0.062
zgc:110333
0.280
oc90
-0.061
si:dkey-19b23.12
0.276
si:ch211-80h18.1
-0.061