Daniocell
LOC110437970 (neural)
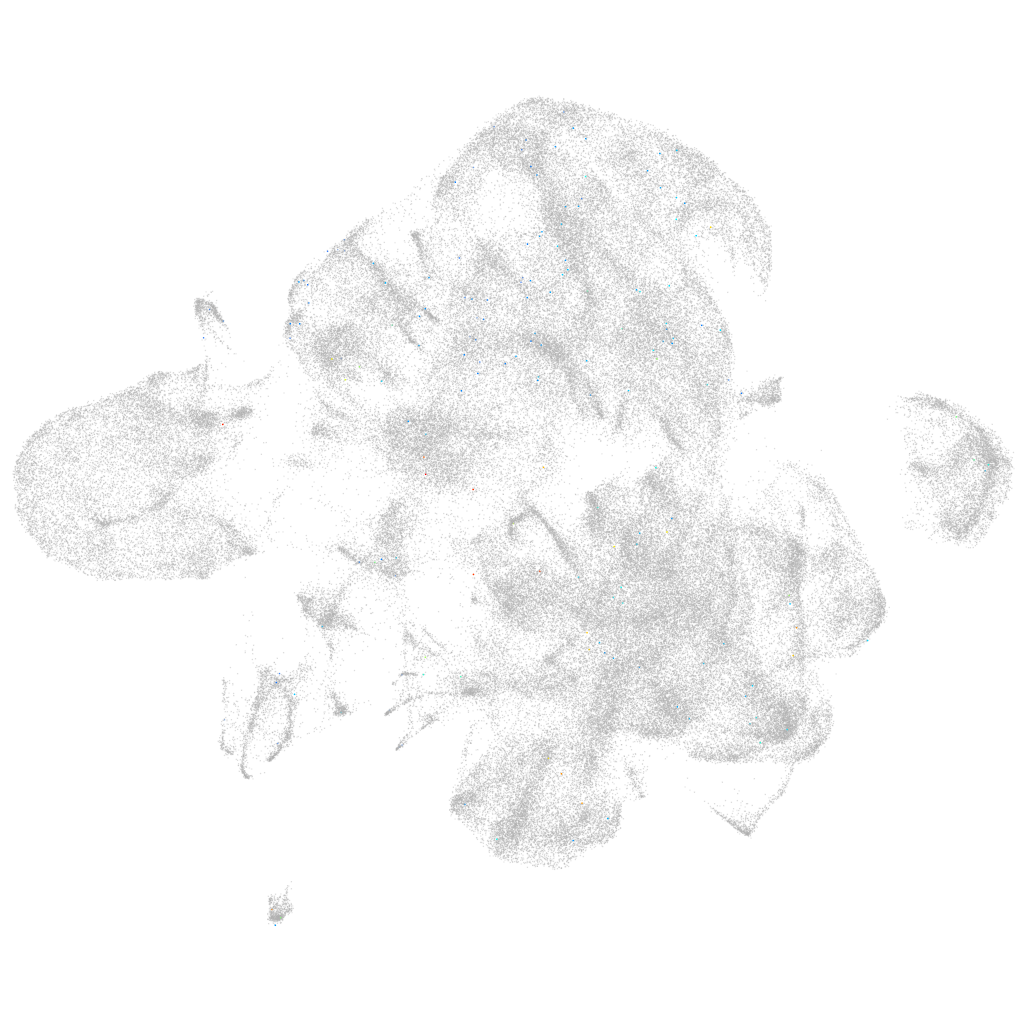
Gene expression UMAP
Display:
Expression
Stage
Other cell groups
all cells
blastomeres
PGCs
endoderm
axial mesoderm
muscle
mural cells /
non-skeletal muscle
mesenchyme
hematopoietic /
vasculature
pronephros
neural
spinal cord / glia
eye
taste / olfactory
otic / lateral line
epidermis
periderm
fin
ionocytes / mucous
pigment cells
Expression by stage/cluster
Correlated gene expression
Positive correlation
Negative correlation
Gene
r
Gene
r
si:ch211-214j8.1
0.114
ptmab
-0.013
XLOC-027769
0.105
fam32a
-0.010
myrfl
0.101
tp53inp2
-0.010
shisa7a
0.074
cfl1
-0.009
dnah5
0.073
tubb2b
-0.009
si:ch211-85n16.4
0.072
hnrnpa1a
-0.009
si:dkey-61f9.2
0.065
sec61b
-0.009
avil
0.064
si:ch211-152c2.3
-0.009
LOC100332187
0.062
ilf3b
-0.009
pla2r1
0.056
si:ch211-222l21.1
-0.009
gdf6b
0.055
stmn1b
-0.009
XLOC-043043
0.054
lsm7
-0.009
si:ch1073-365p7.2
0.054
hnrnpl
-0.009
adamts16
0.052
fez1
-0.009
alpi.2
0.050
hmgb1b
-0.009
LOC100535225
0.047
hdac1
-0.008
znf1028
0.045
marcksl1b
-0.008
ncam3
0.044
apoc1
-0.008
notchl
0.044
zgc:56676
-0.008
xrra1
0.043
snrpa1
-0.008
BX957317.3
0.041
gng2
-0.008
ccdc141
0.041
nr6a1a
-0.008
lrata
0.041
hmgn6
-0.008
si:ch211-199o1.2
0.041
ywhaqb
-0.008
si:dkey-199m13.7
0.040
apoeb
-0.008
mpp5b
0.039
metap2b
-0.008
zgc:113279
0.039
h3f3d
-0.008
epas1b
0.038
hspb1
-0.008
XLOC-039757
0.037
mllt11
-0.008
LOC103909112
0.037
si:dkey-276j7.1
-0.008
rln3a
0.036
srp9
-0.008
enpp1
0.036
zmat2
-0.008
BX323575.1
0.036
nudc
-0.008
rela
0.035
map1aa
-0.007
abcc2
0.035
si:ch211-288g17.3
-0.007