Daniocell
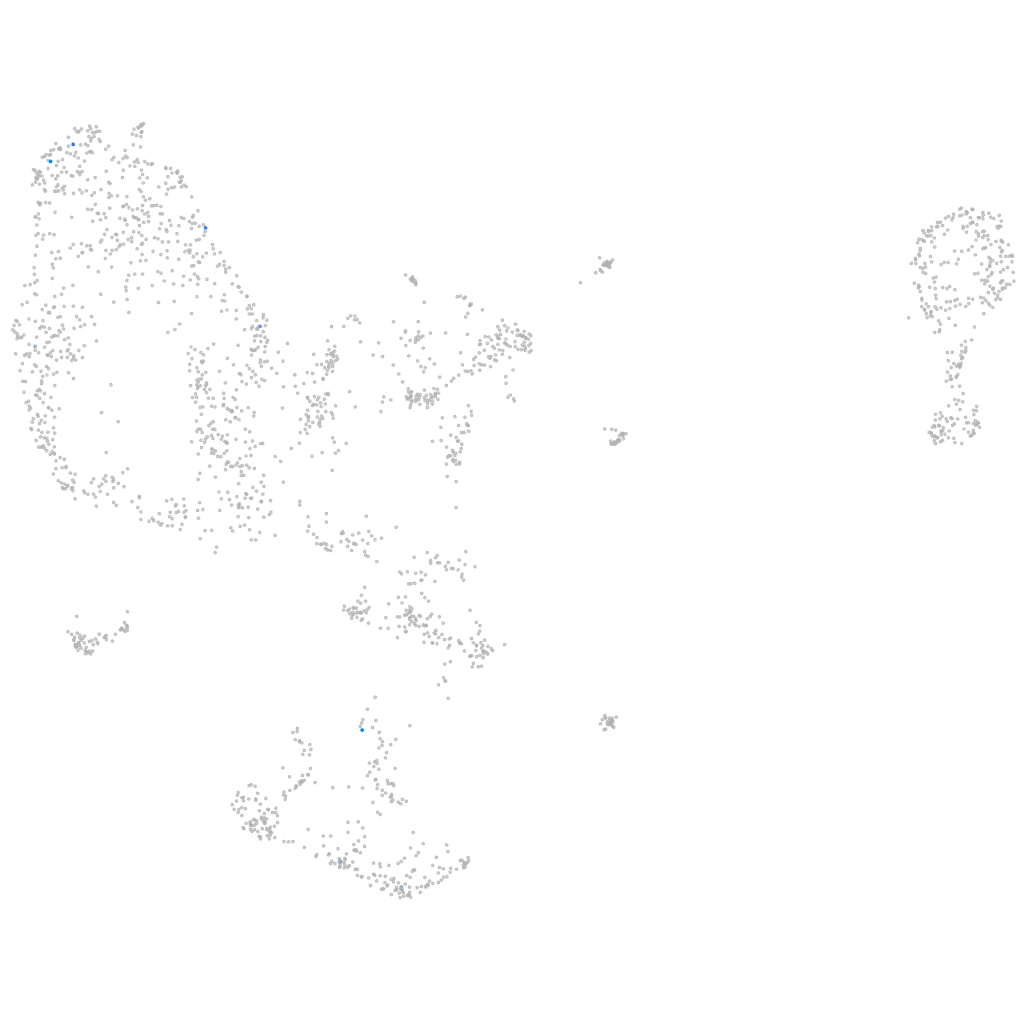
LOC110437970 (pronephros)
Gene expression UMAP
Display:
Expression
Stage
Other cell groups
all cells
blastomeres
PGCs
endoderm
axial mesoderm
muscle
mural cells /
non-skeletal muscle
mesenchyme
hematopoietic /
vasculature
pronephros
neural
spinal cord / glia
eye
taste / olfactory
otic / lateral line
epidermis
periderm
fin
ionocytes / mucous
pigment cells
Expression by stage/cluster
Correlated gene expression
Positive correlation
Negative correlation
Gene
r
Gene
r
LO018324.1
0.539
h2afx1
-0.054
CABZ01070258.1
0.384
rhoab
-0.042
BX005380.2
0.370
smc1al
-0.042
myo7ab
0.356
hnrnpa0a
-0.041
LOC101883771
0.349
cirbpa
-0.039
si:ch211-14a11.2
0.345
si:dkey-67c22.2
-0.038
CR381700.1
0.343
marcksl1b
-0.038
gsto1
0.273
si:ch73-1a9.3
-0.038
FP101861.1
0.267
tma7
-0.037
CABZ01081908.1
0.264
sf3b2
-0.037
CABZ01010098.1
0.250
anp32e
-0.037
btr31
0.248
snrpd2
-0.037
LOC103909932
0.240
setb
-0.036
CU928847.1
0.240
ubtf
-0.036
CR944667.3
0.240
si:dkey-286j15.1
-0.036
epx
0.236
fam53b
-0.036
actn2b
0.224
tbcb
-0.036
nrg2a
0.223
ube2e1
-0.035
si:ch211-11c3.12
0.219
hp1bp3
-0.035
LOC110439128
0.219
hnrnpub
-0.035
oprm1
0.213
marcksb
-0.035
znf985
0.211
glulb
-0.035
actc1c
0.209
si:ch211-217k17.7
-0.035
LOC101884404
0.205
sub1a
-0.035
arl3l1
0.203
srsf2a
-0.035
LOC100149190
0.199
si:dkey-42i9.4
-0.034
XLOC-034492
0.194
ptges3b
-0.034
mlxipl
0.189
pabpn1
-0.034
CNNM1
0.175
u2af2b
-0.034
KIRREL3
0.172
drap1
-0.034
ftr05
0.167
tcea1
-0.034
LOC103908995
0.166
kctd5a
-0.034
ifnphi3
0.164
sumo3a
-0.034
card11
0.163
psmc1a
-0.033
XLOC-001742
0.161
khdrbs1b
-0.033