Daniocell
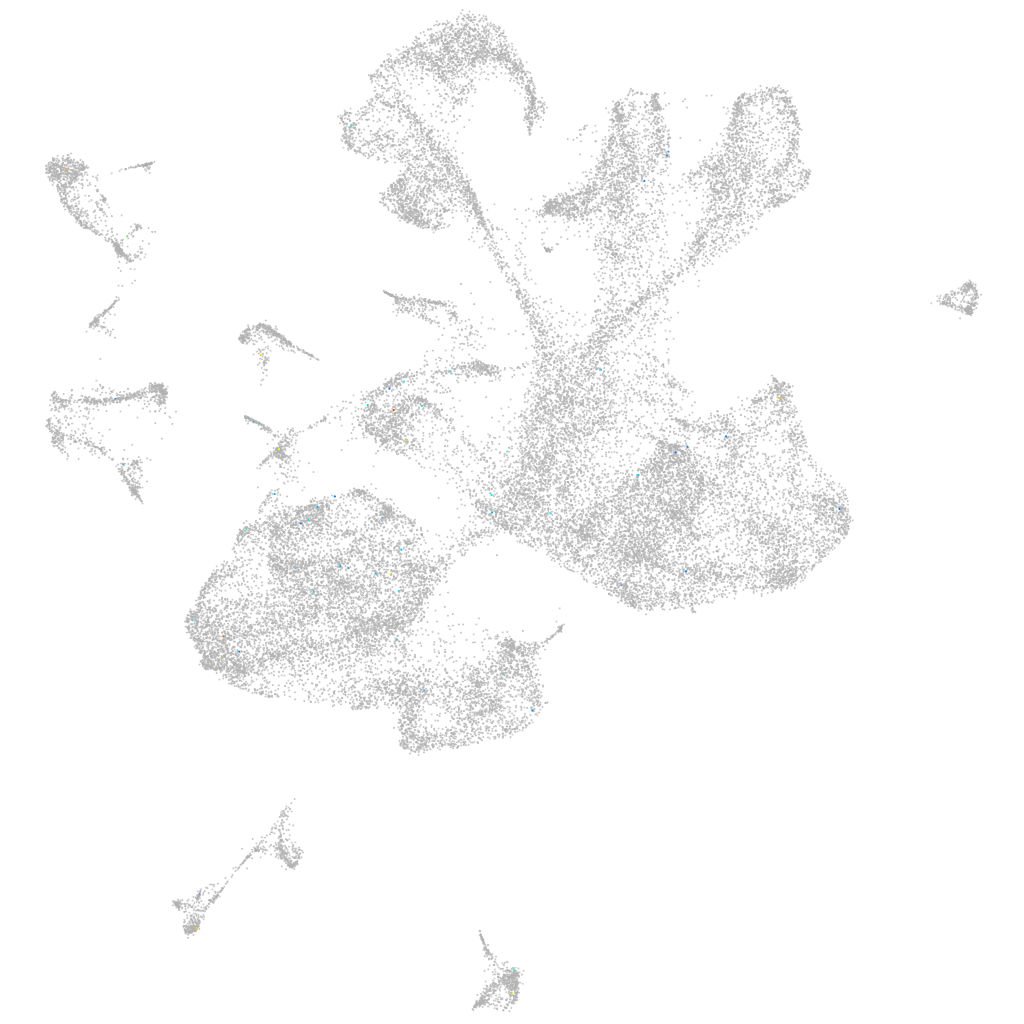
LOC110437970 (glial cells / spinal cord)
Gene expression UMAP
Display:
Expression
Stage
Other cell groups
all cells
blastomeres
PGCs
endoderm
axial mesoderm
muscle
mural cells /
non-skeletal muscle
mesenchyme
hematopoietic /
vasculature
pronephros
neural
spinal cord / glia
eye
taste / olfactory
otic / lateral line
epidermis
periderm
fin
ionocytes / mucous
pigment cells
Expression by stage/cluster
Correlated gene expression
Positive correlation
Negative correlation
Gene
r
Gene
r
LOC110438806
0.256
h3f3d
-0.031
angpt2a
0.162
hsp90ab1
-0.025
CABZ01080371.3
0.125
si:ch211-222l21.1
-0.024
si:ch73-329n5.1
0.123
hmga1a
-0.022
c3a.5
0.109
hmgb1b
-0.022
LOC101882642
0.108
tubb2b
-0.022
scxb
0.106
tuba1c
-0.022
cngk
0.102
ptmab
-0.022
RF00211
0.101
elavl3
-0.022
si:ch211-277e21.1
0.095
srsf3b
-0.021
CR376740.2
0.085
rps9
-0.021
CABZ01077956.1
0.085
hnrnpa0b
-0.021
slc19a3a
0.084
syncrip
-0.021
gprc6a
0.078
NC-002333.4
-0.020
CABZ01088367.1
0.071
h3f3a
-0.020
LOC101886973
0.071
rpl5a
-0.020
BX510301.2
0.071
smarce1
-0.020
foxi3a
0.070
rps3
-0.020
LOC101882257
0.069
hnrnpa0l
-0.019
pcdh1gb9
0.067
si:ch211-288g17.3
-0.019
itga11b
0.066
marcksb
-0.019
CU207301.2
0.064
khdrbs1a
-0.019
XLOC-006525
0.062
alyref
-0.019
AL929276.1
0.062
chd4a
-0.018
si:dkey-228a15.1
0.057
hnrnpaba
-0.018
sh3gl3b
0.057
cirbpa
-0.018
LOC101886468
0.057
snrpb
-0.018
dnai2a
0.057
apex1
-0.018
LOC103909512
0.056
eef1g
-0.018
ccl20a.3
0.055
srsf11
-0.018
si:dkey-9i23.6
0.055
top2b
-0.017
si:ch211-66k16.28
0.054
si:ch73-1a9.3
-0.017
BX957292.1
0.053
hoxb9a
-0.017
si:dkey-188i13.10
0.053
ddx39ab
-0.017
AL929114.1
0.052
hmgn2
-0.016