Daniocell
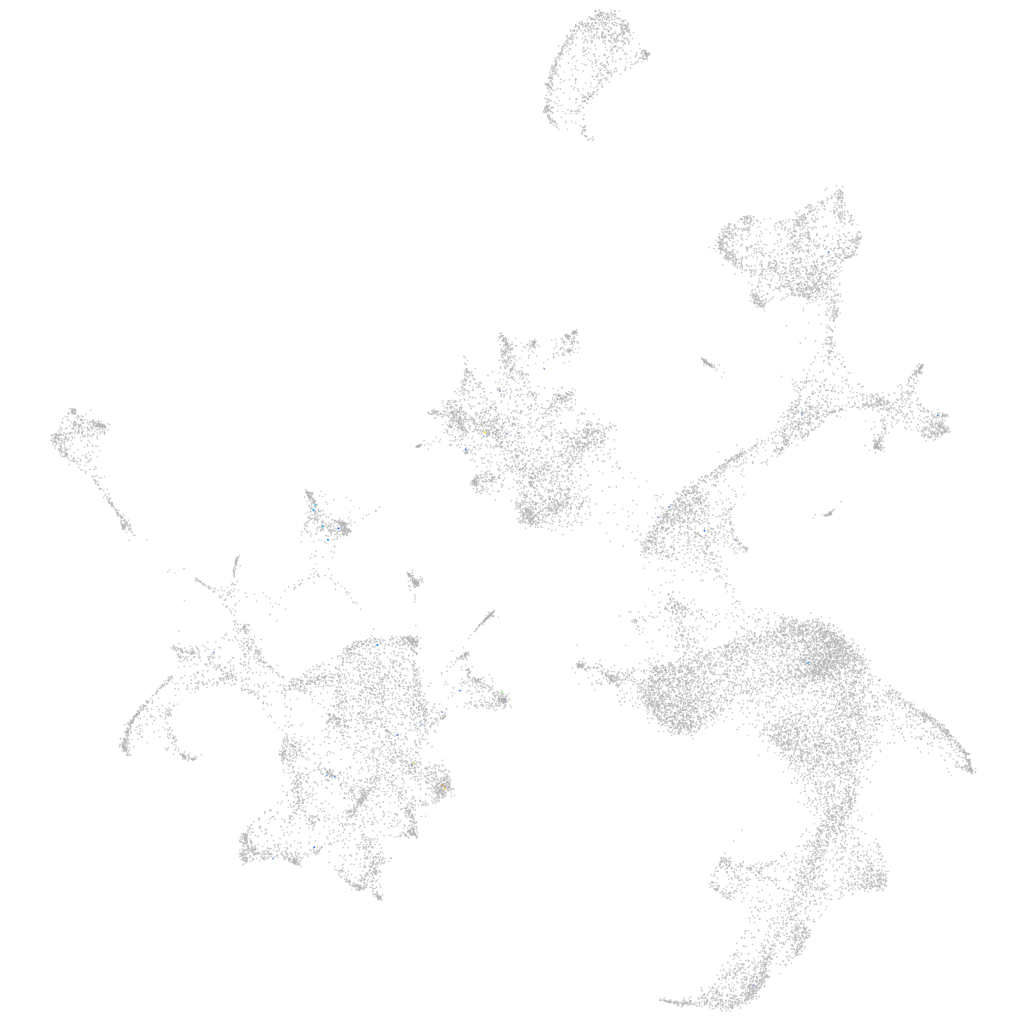
LOC110437970 (hematopoietic / vasculature)
Gene expression UMAP
Display:
Expression
Stage
Other cell groups
all cells
blastomeres
PGCs
endoderm
axial mesoderm
muscle
mural cells /
non-skeletal muscle
mesenchyme
hematopoietic /
vasculature
pronephros
neural
spinal cord / glia
eye
taste / olfactory
otic / lateral line
epidermis
periderm
fin
ionocytes / mucous
pigment cells
Expression by stage/cluster
Correlated gene expression
Positive correlation
Negative correlation
Gene
r
Gene
r
BX571794.3
0.343
fth1a
-0.021
rundc3b
0.227
hbae1.3
-0.021
LOC101882365
0.219
hbbe2
-0.021
zgc:153499
0.217
prdx2
-0.021
arhgef19
0.215
hbae1.1
-0.020
XLOC-009562
0.211
cahz
-0.020
LOC100006699
0.188
alas2
-0.019
dnah2
0.163
hbbe1.1
-0.019
chpfb
0.159
zgc:56095
-0.019
LOC110439875
0.151
hbbe1.2
-0.019
CABZ01044099.1
0.149
nt5c2l1
-0.017
CU463231.2
0.142
si:ch211-250g4.3
-0.017
XLOC-026547
0.141
hemgn
-0.017
FP102171.1
0.141
hbbe1.3
-0.017
soat1
0.135
blvrb
-0.017
XLOC-004843
0.125
epb41b
-0.017
miga2
0.124
hbae3
-0.016
CR356246.1
0.116
slc4a1a
-0.016
tecpr1b
0.115
zgc:163057
-0.016
tfpi2
0.113
creg1
-0.016
si:ch73-281i18.4
0.112
hbbe3
-0.014
mfsd4ab
0.111
add2
-0.014
si:ch73-233f7.3
0.107
si:ch211-207c6.2
-0.014
si:dkey-19f4.2
0.106
tmem14ca
-0.013
LOC110439128
0.103
plac8l1
-0.013
tmem41ab
0.103
si:dkey-240n22.3
-0.013
znf1163
0.102
znfl2a
-0.013
CABZ01066224.1
0.100
tspo
-0.012
LOC101885373
0.100
histh1l
-0.012
rxfp3.2b
0.098
CR293511.1
-0.012
tuft1b
0.095
mcl1a
-0.012
ephb1
0.095
tmod4
-0.012
LOC103908875
0.095
zgc:92606
-0.011
si:zfos-323e3.4
0.094
arl6ip1
-0.011
CU633785.1
0.092
glrx5
-0.011