Daniocell
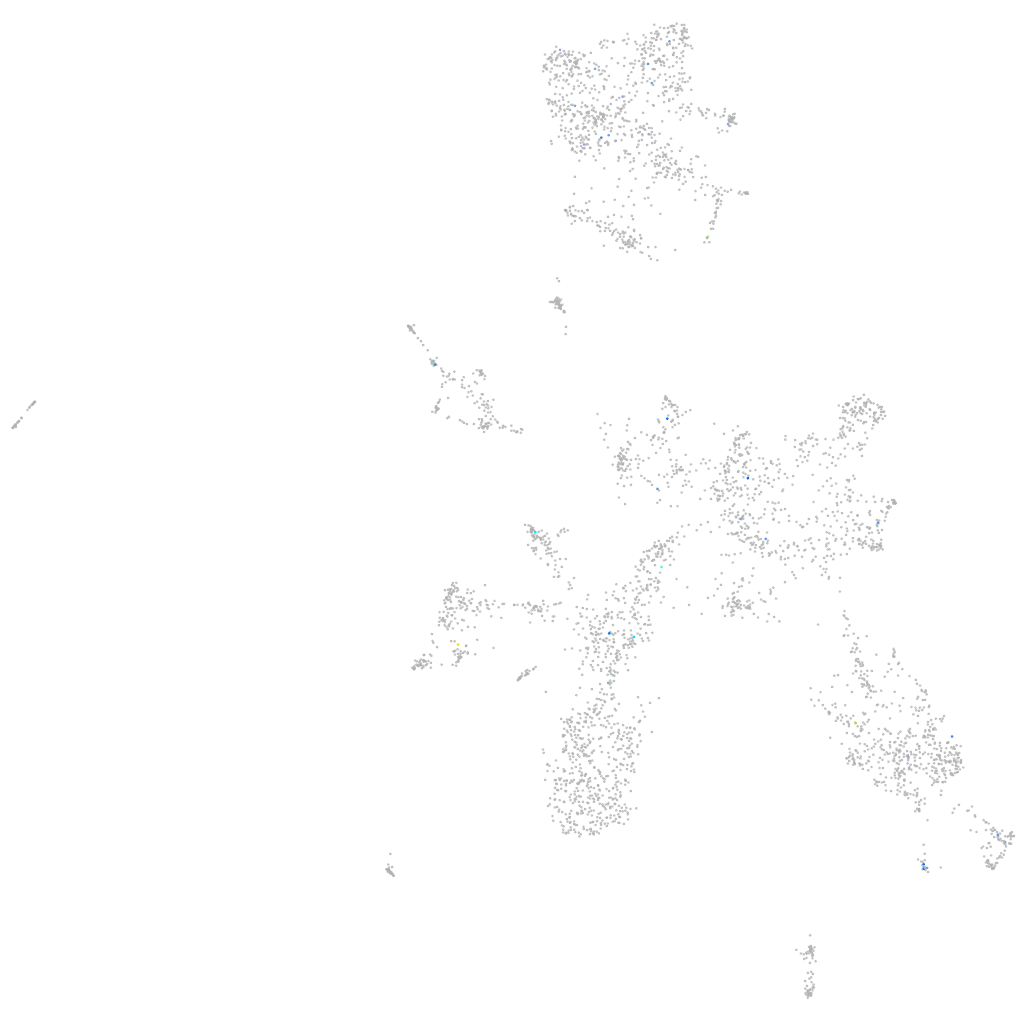
LOC110437970 (taste / olfactory)
Gene expression UMAP
Display:
Expression
Stage
Other cell groups
all cells
blastomeres
PGCs
endoderm
axial mesoderm
muscle
mural cells /
non-skeletal muscle
mesenchyme
hematopoietic /
vasculature
pronephros
neural
spinal cord / glia
eye
taste / olfactory
otic / lateral line
epidermis
periderm
fin
ionocytes / mucous
pigment cells
Expression by stage/cluster
Correlated gene expression
Positive correlation
Negative correlation
Gene
r
Gene
r
znf1080
0.275
histh1l
-0.049
BX510301.2
0.273
max
-0.043
mir30d
0.273
psma1
-0.039
AL954861.1
0.267
zgc:153409
-0.038
LOC100536643
0.263
alyref
-0.037
sdsl
0.263
baz2ba
-0.036
CR762475.1
0.244
prkcsh
-0.036
XLOC-042292
0.220
rcc2
-0.035
LOC101886687
0.219
sec11a
-0.034
si:ch73-185c24.2
0.204
rbm5
-0.034
LOC101885577
0.202
psmb5
-0.033
LOC103910941
0.202
hmgn3
-0.033
gabrr3a
0.191
polr2d
-0.032
stc2b
0.189
hmgb1b
-0.032
si:dkey-97l20.6
0.178
msl2b
-0.032
si:cabz01030277.1
0.176
cyt1l
-0.031
CR847530.1
0.168
cdh1
-0.031
BX663613.1
0.168
hmga1b
-0.031
si:ch211-131k2.3
0.167
srsf3b
-0.031
gga3b
0.165
mbpb
-0.031
LOC100538233
0.163
med21
-0.031
CT025912.1
0.160
ppib
-0.031
flnb
0.155
si:dkey-42i9.4
-0.030
rapgefl1
0.155
h2afva
-0.030
LOC110439398
0.155
flot1b
-0.030
LOC100150095
0.152
dctn2
-0.030
plppr5b
0.150
tegt
-0.029
si:cabz01023700.1
0.150
psmd7
-0.029
c9
0.150
manf
-0.029
slc26a10
0.149
pax6a
-0.029
LOC110439758
0.148
setb
-0.029
si:dkeyp-87a6.2
0.146
pcf11
-0.029
XLOC-033024
0.146
ptges3a
-0.029
si:dkey-24c2.7
0.143
arl14ep
-0.029
CU571064.1
0.143
si:ch211-15b10.6
-0.028