Daniocell
LOC110437970 (eye)
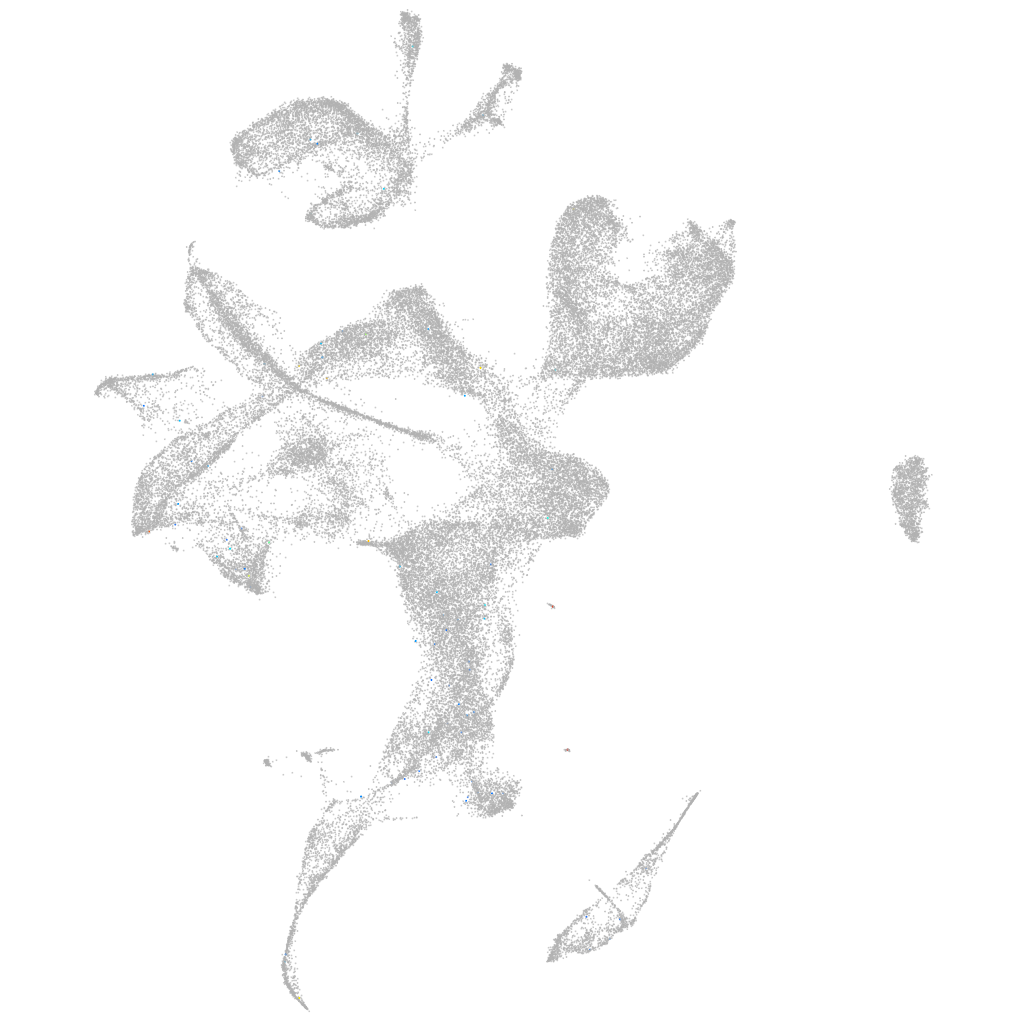
Gene expression UMAP
Display:
Expression
Stage
Other cell groups
all cells
blastomeres
PGCs
endoderm
axial mesoderm
muscle
mural cells /
non-skeletal muscle
mesenchyme
hematopoietic /
vasculature
pronephros
neural
spinal cord / glia
eye
taste / olfactory
otic / lateral line
epidermis
periderm
fin
ionocytes / mucous
pigment cells
Expression by stage/cluster
Correlated gene expression
Positive correlation
Negative correlation
Gene
r
Gene
r
LOC100537499
0.256
ptmab
-0.019
BX571945.2
0.251
marcksl1b
-0.017
dnah1
0.164
hmgn2
-0.016
RF00443
0.158
gpm6aa
-0.015
BX649499.1
0.150
dynll1
-0.014
LOC110439575
0.126
cirbpb
-0.014
LOC110438777
0.125
pvalb2
-0.013
pcgf5b
0.122
neurod4
-0.013
ttc6
0.119
csnk1a1
-0.013
rxfp2l
0.112
gng13b
-0.013
dnah2
0.111
hmgn6
-0.013
XLOC-018346
0.103
tp53inp2
-0.013
si:dkey-193n17.9
0.100
sumo3a
-0.012
hdac7a
0.099
jpt1b
-0.012
paplnb
0.089
ubc
-0.012
LO017643.1
0.086
hmgb1b
-0.012
asb10
0.079
ip6k2a
-0.012
si:ch211-23l10.3
0.075
si:ch1073-429i10.3.1
-0.011
ggt1b
0.074
hnrnpaba
-0.011
lhx2a
0.071
hmga1a
-0.011
CU571319.1
0.071
eef1g
-0.011
LOC110439528
0.070
h2afvb
-0.011
slc13a1
0.070
vsx1
-0.011
si:ch73-256j6.4
0.065
gnao1b
-0.011
pex5la
0.063
brk1
-0.011
itpripl2
0.062
gabarapb
-0.011
si:ch211-67f13.7
0.058
cyt1
-0.011
nptx2b
0.058
dcaf7
-0.011
si:dkey-14d8.20
0.056
pvalb1
-0.011
LOC101885989
0.056
sox11a
-0.011
spata18
0.056
sumo2b
-0.011
LOC103908899
0.056
hbbe1.3
-0.011
si:ch211-184m13.4
0.055
smarce1
-0.011
XLOC-011830
0.055
calb2b
-0.010
illr4
0.055
tpi1b
-0.010