Daniocell
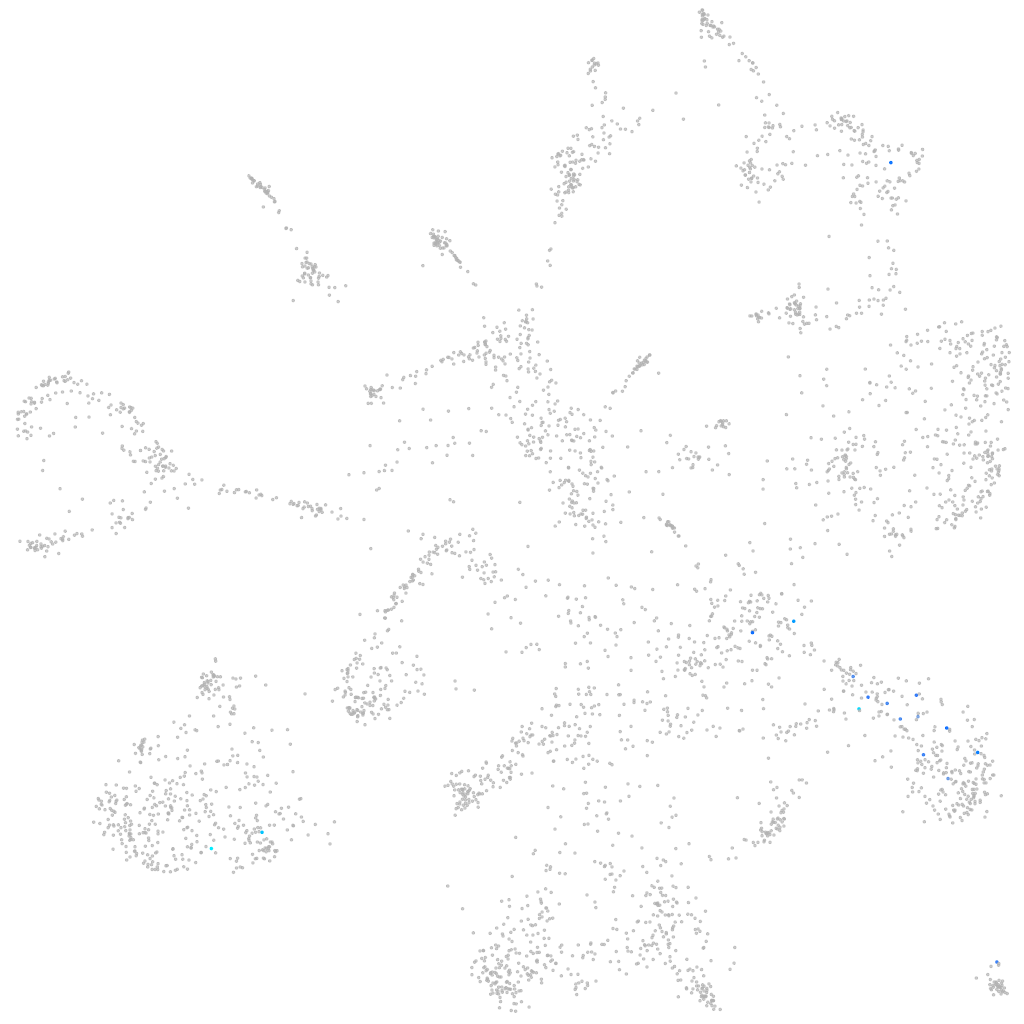
hist1h2a1 (mural cells / non-skeletal muscle)
histone cluster 1 H2A family member1
ZFIN
Gene expression UMAP
Display:
Expression
Stage
Other cell groups
all cells
blastomeres
PGCs
endoderm
axial mesoderm
muscle
mural cells /
non-skeletal muscle
mesenchyme
hematopoietic /
vasculature
pronephros
neural
spinal cord / glia
eye
taste / olfactory
otic / lateral line
epidermis
periderm
fin
ionocytes / mucous
pigment cells
Expression by stage/cluster
Correlated gene expression
Positive correlation
Negative correlation
Gene
r
Gene
r
LOC570405.1
0.417
sparc
-0.055
BX005380.2
0.376
col6a2
-0.051
si:ch1073-335m2.2
0.376
myl9a
-0.050
XLOC-020187
0.349
mfap2
-0.050
sh3bp2
0.344
col1a1a
-0.047
itga3a
0.327
col1a2
-0.046
LOC108183760
0.316
zgc:162730
-0.046
si:ch211-222k6.1
0.305
tagln
-0.042
XLOC-012761
0.287
tpm1
-0.042
citb
0.263
cdc42
-0.040
cbln8
0.261
col6a3
-0.039
CABZ01066921.1
0.237
rbp4
-0.039
XLOC-042909
0.232
fn1b
-0.039
si:dkey-40j3.3
0.223
tmsb4x
-0.038
lrrc30a
0.218
col6a1
-0.038
si:ch211-22d5.2
0.215
cd63
-0.038
XLOC-005276
0.211
tpm2
-0.037
XLOC-023448
0.208
col4a1
-0.037
XLOC-017499
0.207
STMP1
-0.036
si:dkey-63j12.4
0.205
capns1a
-0.036
XLOC-030513
0.203
ppt1
-0.035
FO904966.2
0.200
mylkb
-0.035
CU457819.1
0.199
lama4
-0.035
zgc:113984.1
0.199
acta2
-0.035
FO834799.1
0.198
lxn
-0.034
LOC100148648
0.196
oaz1a
-0.034
fsip1
0.195
lmod1b
-0.034
zgc:173552
0.194
dap1b
-0.034
slc44a5a
0.193
cxcl14
-0.033
ftr37
0.193
aoc2
-0.032
si:ch211-113a14.18
0.191
kctd12.2
-0.032
CR354435.2
0.190
zgc:153704
-0.032
CR376766.2
0.188
col5a2a
-0.031
si:dkey-150i13.2
0.187
eef1da
-0.031
atoh1b
0.186
lrrc17
-0.031