Daniocell
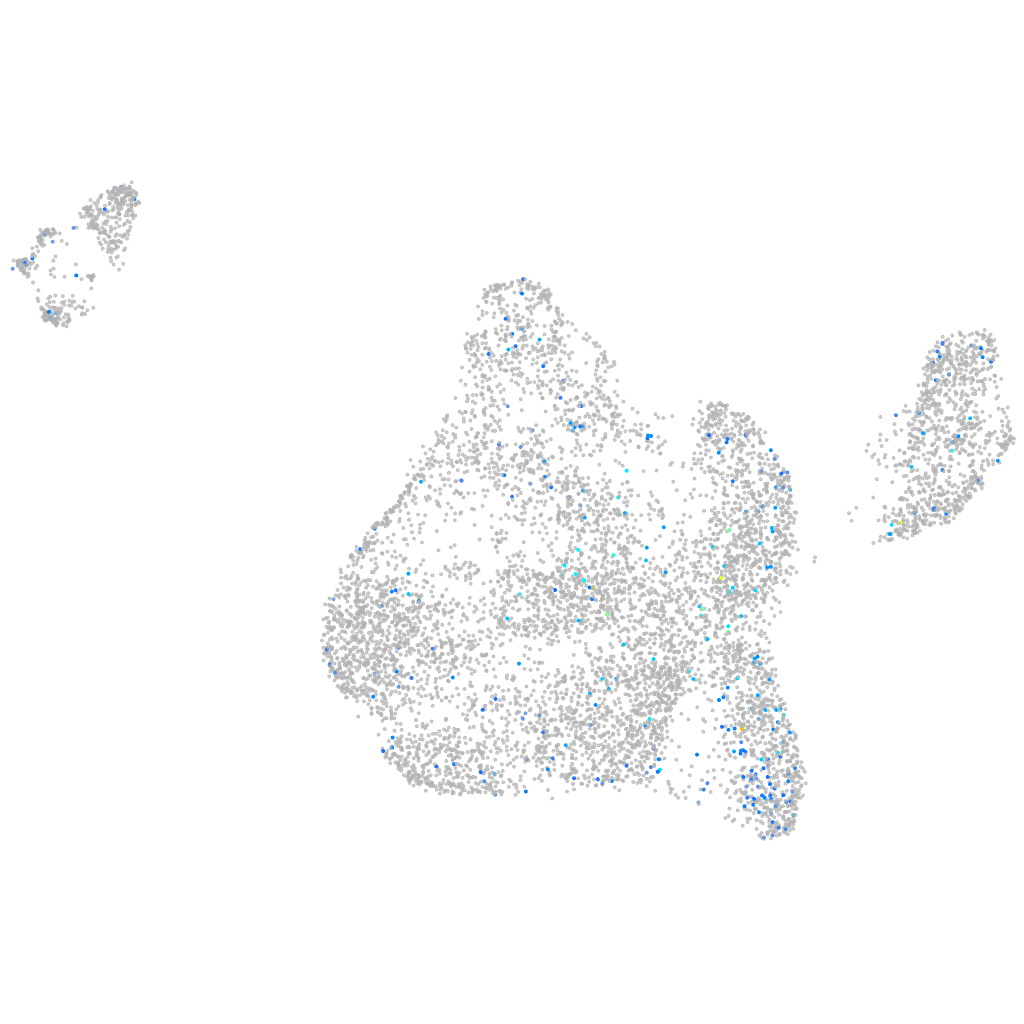
hist1h2a1 (blastomeres)
histone cluster 1 H2A family member1
ZFIN
Gene expression UMAP
Display:
Expression
Stage
Other cell groups
all cells
blastomeres
PGCs
endoderm
axial mesoderm
muscle
mural cells /
non-skeletal muscle
mesenchyme
hematopoietic /
vasculature
pronephros
neural
spinal cord / glia
eye
taste / olfactory
otic / lateral line
epidermis
periderm
fin
ionocytes / mucous
pigment cells
Expression by stage/cluster
Correlated gene expression
Positive correlation
Negative correlation
Gene
r
Gene
r
prkchb
0.132
COX3
-0.075
zgc:153405
0.129
mt-co2
-0.060
si:ch1073-153i20.4
0.129
NC-002333.4
-0.049
si:dkey-23a13.17
0.122
mt-cyb
-0.048
si:dkey-108k21.14
0.120
sumo3b
-0.037
XLOC-004932
0.115
rps26l
-0.036
si:ch211-113a14.18
0.106
psmb6
-0.035
si:dkey-108k21.10
0.106
eny2
-0.034
si:dkey-23a13.9
0.102
znfl2a
-0.034
si:dkey-108k21.21
0.099
h2afvb
-0.033
hist1h2a3
0.098
rpl17
-0.033
si:dkey-261m9.12
0.098
rpl26
-0.031
fli1b
0.096
ctnnbip1
-0.031
si:ch211-113a14.24
0.096
BX957251.1
-0.031
ftr85
0.094
si:dkey-9c18.3
-0.030
si:dkey-96f10.1
0.094
lig1
-0.030
LO018238.1
0.093
hs6st2
-0.030
si:ch73-368j24.12
0.093
inka1b
-0.030
zgc:110216
0.092
rpl31
-0.030
LOC101887081
0.091
ppp2cb
-0.029
LOC103910666
0.091
yipf3
-0.029
CABZ01068842.1
0.087
ppiaa
-0.029
si:ch73-36p18.1
0.083
lsm12b
-0.029
si:ch1073-159d7.7
0.082
ucp2
-0.029
zgc:110425
0.080
cdk9
-0.029
si:ch211-217i17.1
0.079
pdcd4a
-0.028
LOC110439797
0.079
si:ch211-86h15.1
-0.028
LOC570163
0.079
esf1
-0.028
si:dkey-237j11.3
0.079
sf3b3
-0.028
CR545466.1
0.079
zmp:0000000624
-0.028
styk1a
0.078
paip2b
-0.028
BX323991.1
0.078
aldh7a1
-0.028
CU856343.1
0.077
mettl5
-0.028
XLOC-013065
0.076
rpl12
-0.028
BX511253.1
0.075
nsmce1
-0.027